In the context of the horrible fires we’ve seen in recent weeks – with so many of our communities and neighbors so terribly affected – a real estate report seems trivial. But since I have clients still trying to make buying and selling decisions, I’ll continue to deliver straightforward data on market conditions.
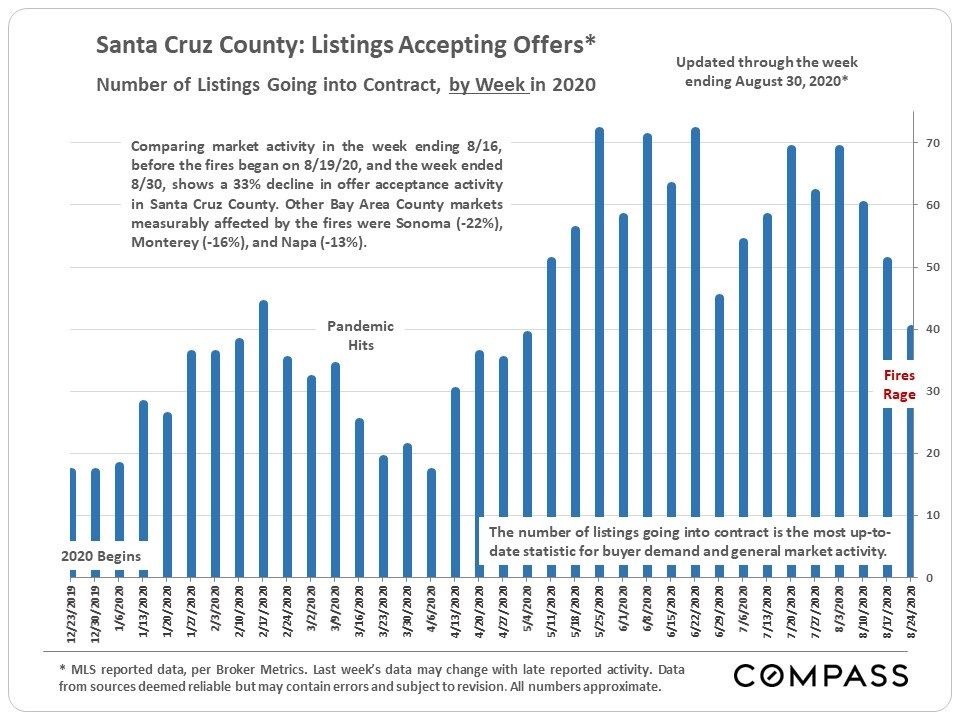
Surprisingly, the fires did not significantly impact the number of deals being made in most Bay Area counties during the last 2 weeks of August – the exceptions being those worst affected by the crisis: Santa Cruz (-33%), Sonoma (-22%), Monterey (-16) and Napa (-13%). However, activity began to pick up again in Santa Cruz County in the first week of September – though still about 20% below the pre-fire level. (This week by week chart runs through the end of August.)
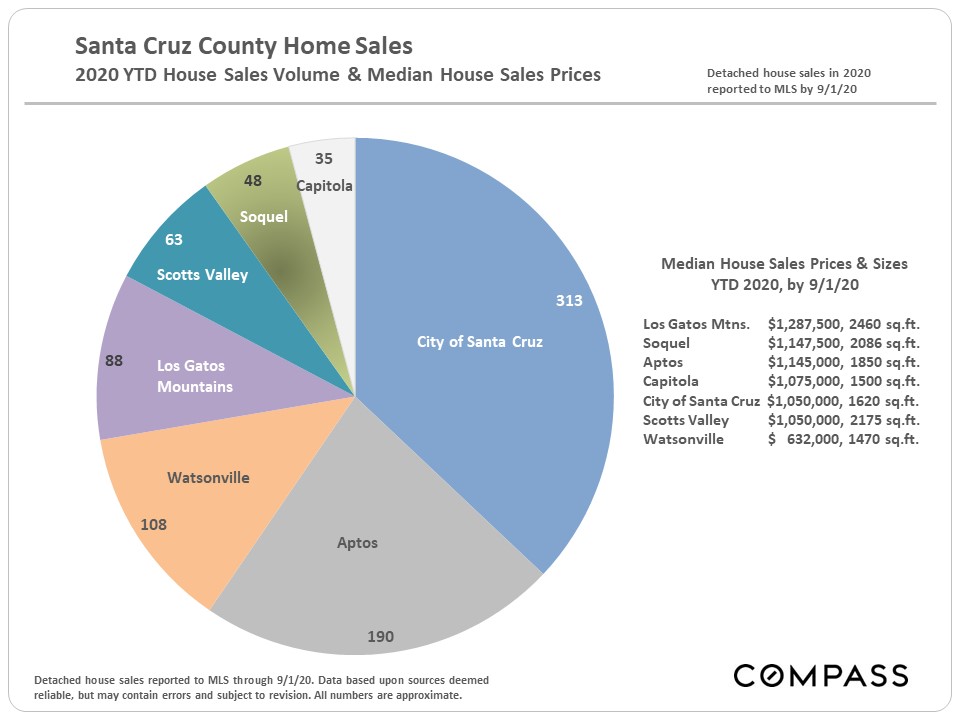
Year-to-date house sales volumes and median sales prices by city:
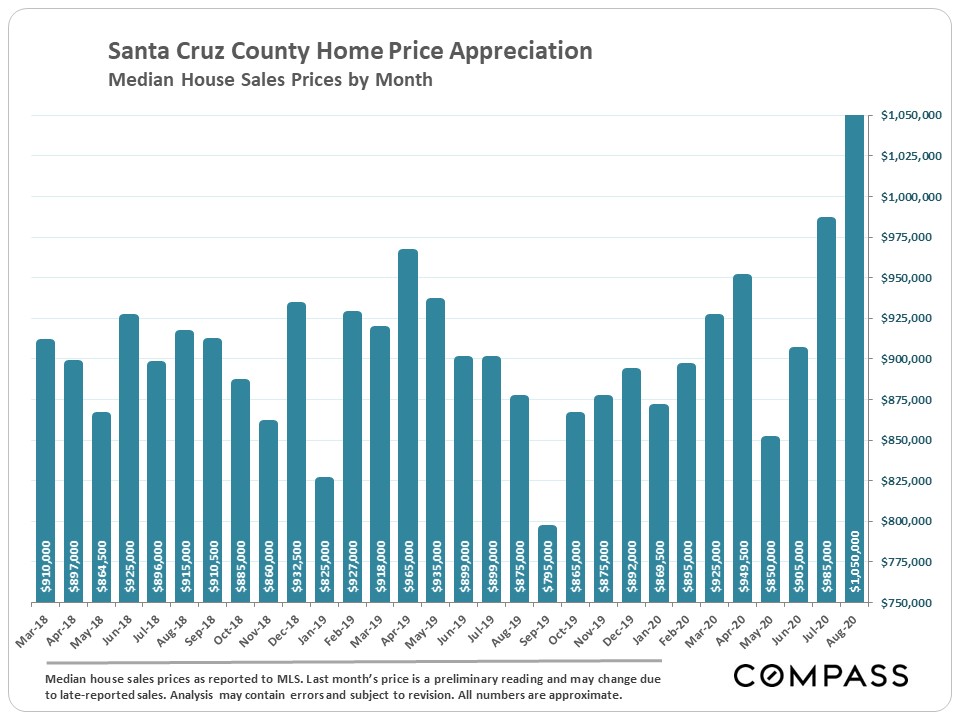
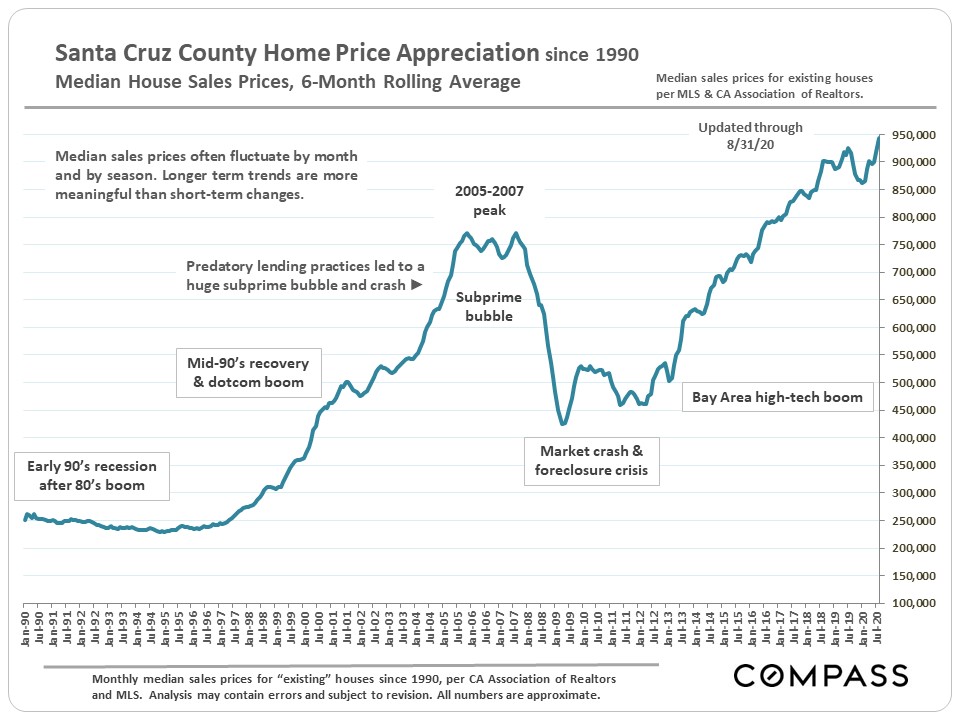
Short-term and long-term median house sales price trends are illustrated in the following two charts.
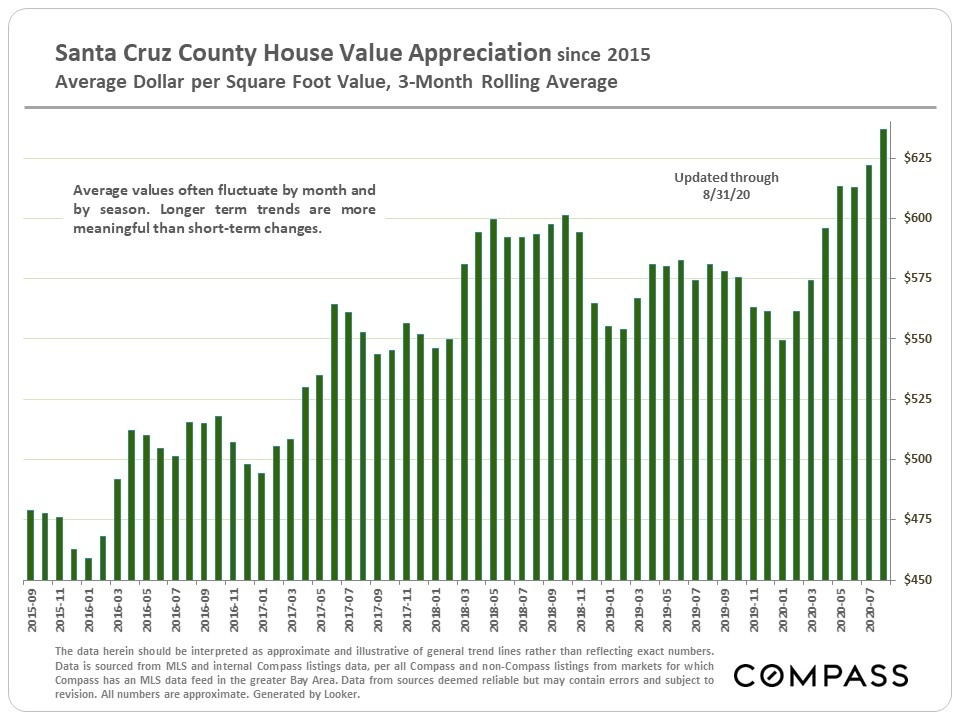
Average house dollar per square foot values:
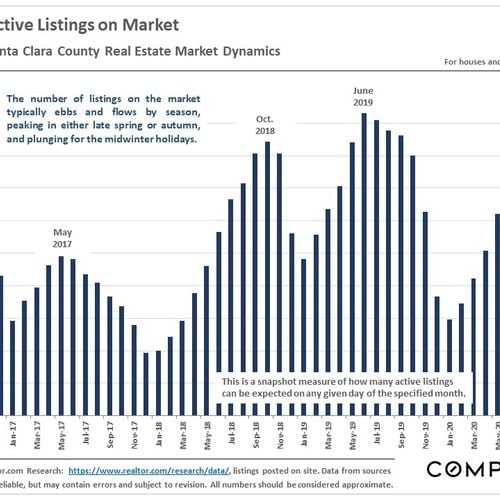
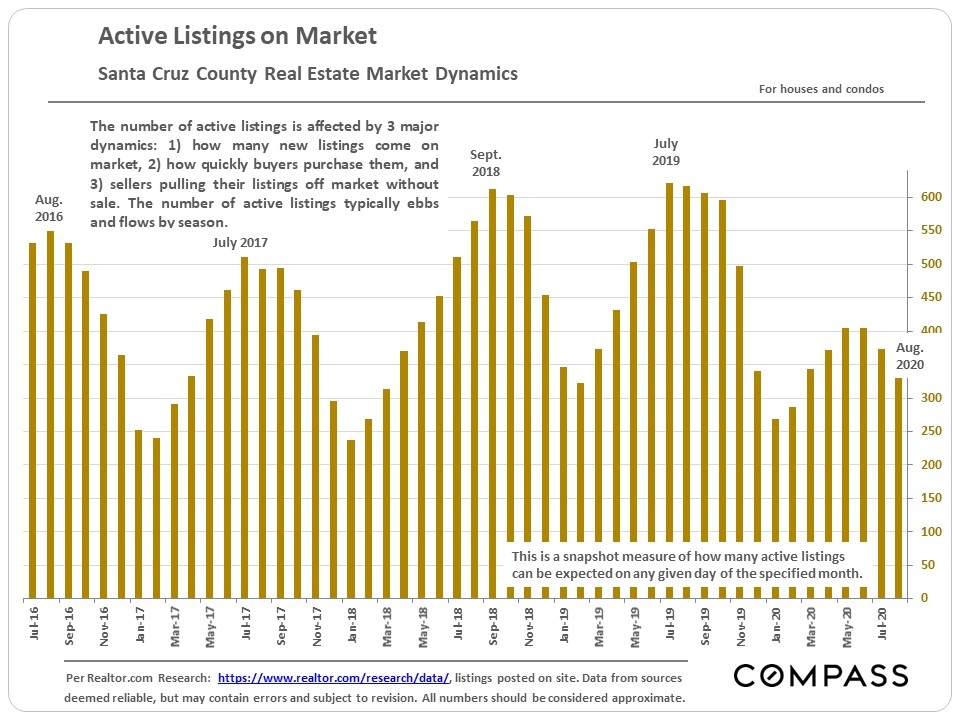
A snapshot measure of how many listings were typically active on any given day of the specified month: Inventory levels have been running very low, a big factor in market dynamics.
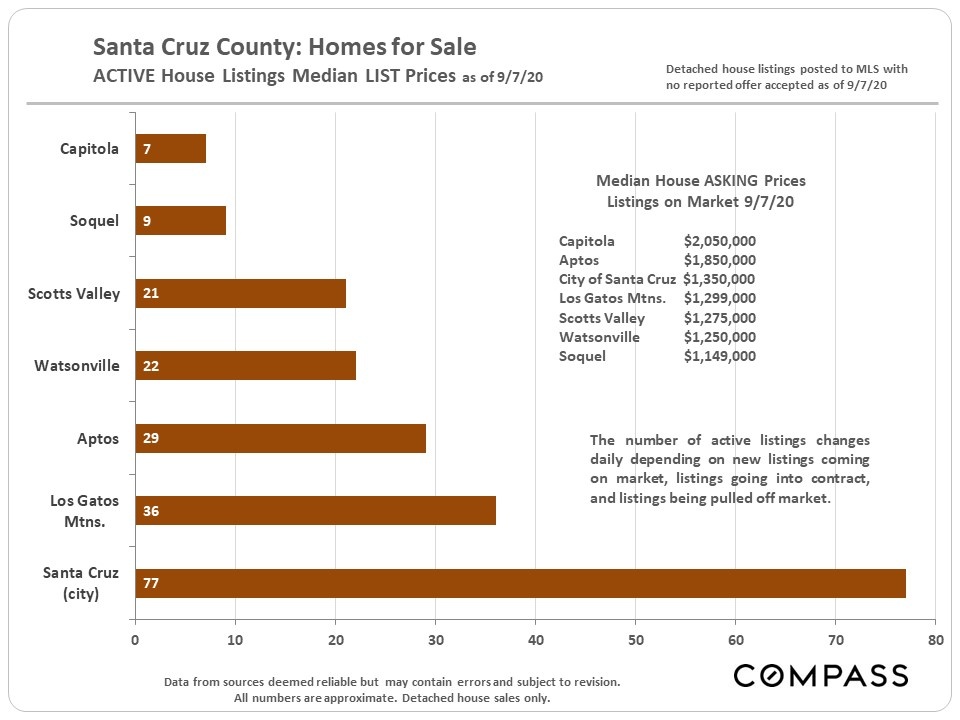
Active house listings and median house asking prices by city, as of 9/7/20: These numbers will change daily with ongoing market activity.
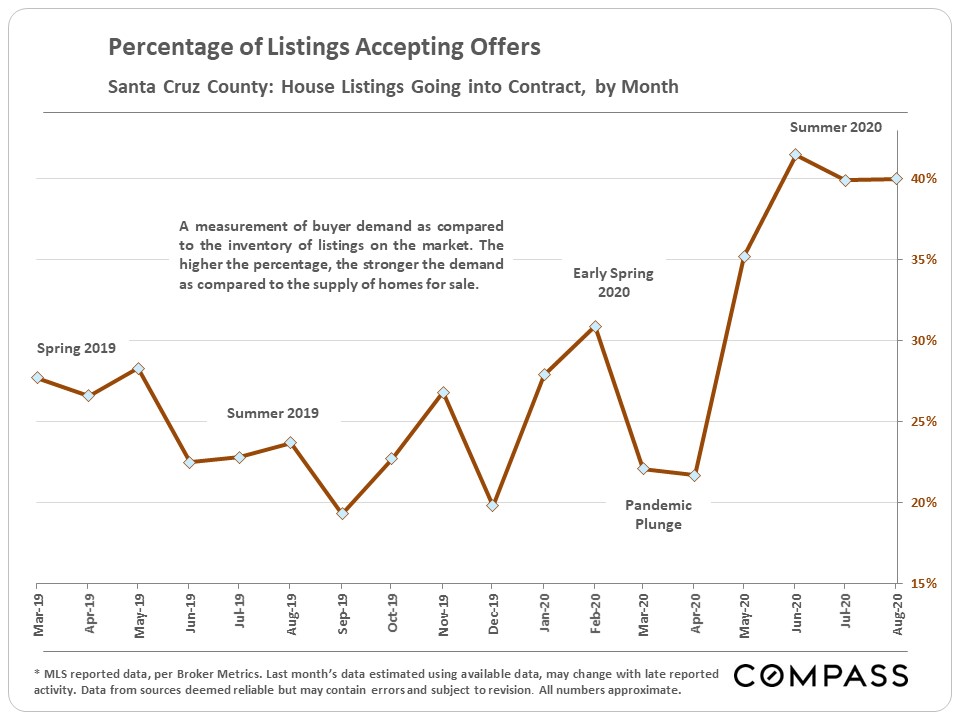
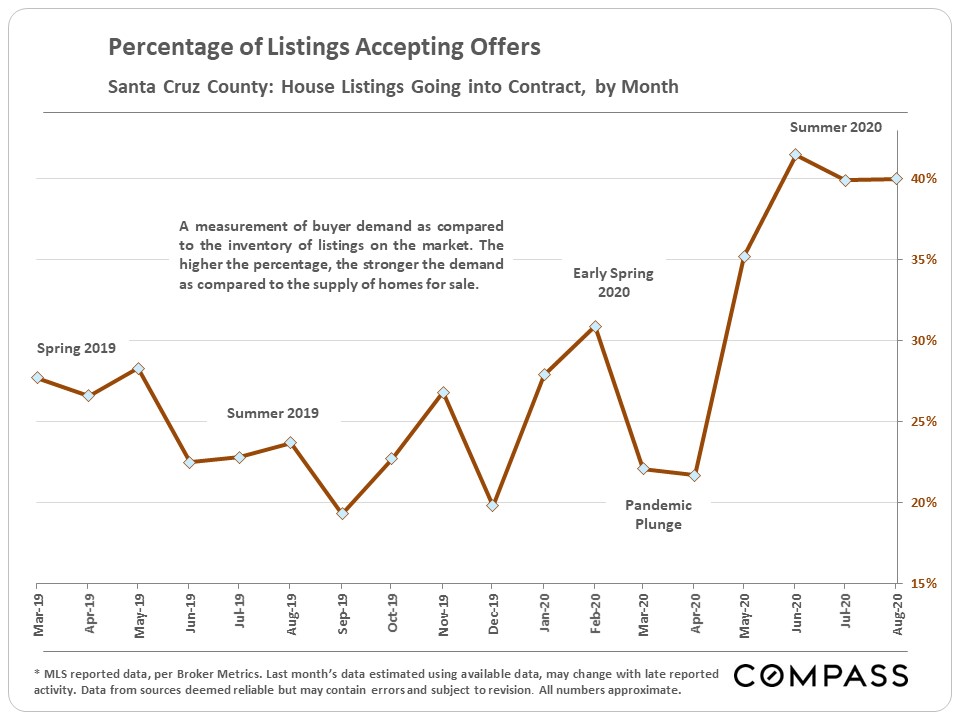
The percentage of active listings going into contract by month: A clear indicator of how high buyer demand has been this summer.
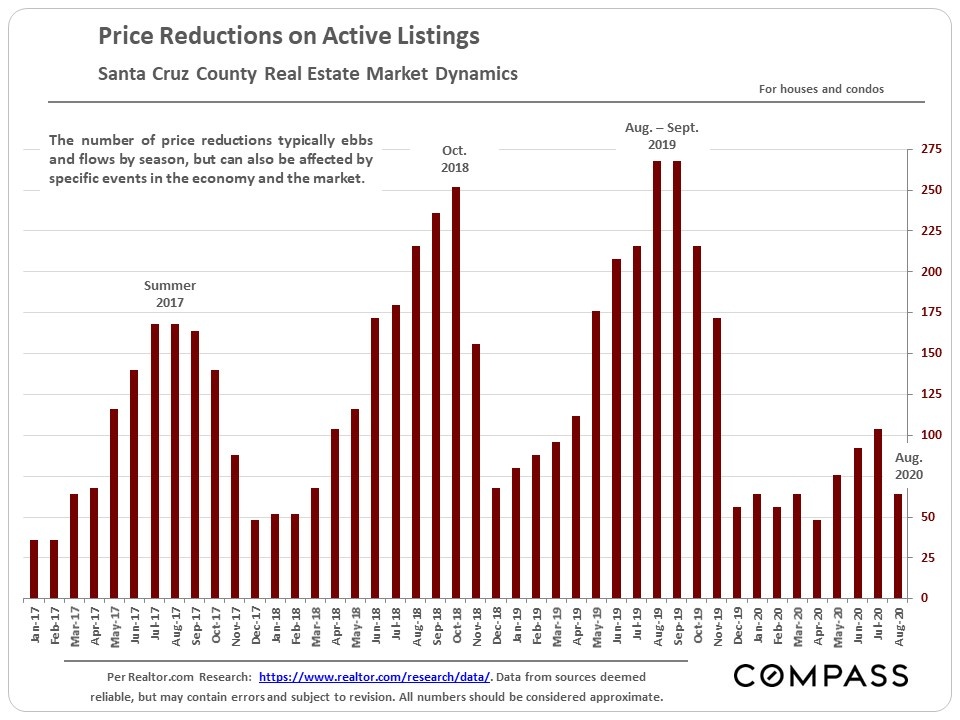
The number of price reductions has been very low, another indicator of a very strong market.
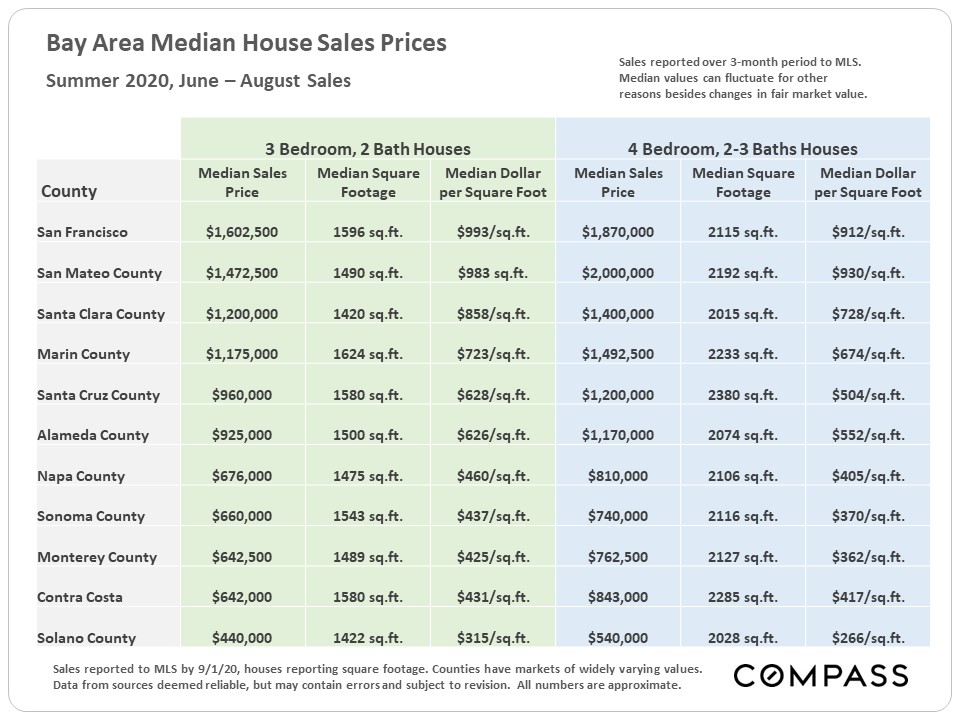
Bay Area median house values and sizes in summer 2020: One factor in the Santa Cruz County market has been its relative affordability as compared to counties to its north.
