There’s no question that 2020 was unlike any year in living memory, and 2021 certainly got off to a rocky start. I’m optimistic that much of the turbulence is behind us, and that we’ll be looking forward to a year of regrowth and relative normalcy. However, this Santa Cruz County 2020 Real Estate Wrap-Up will be looking back on the year as a whole.
To begin, let’s compare the Santa Cruz 2020 real estate market compared to the three years which preceded it:
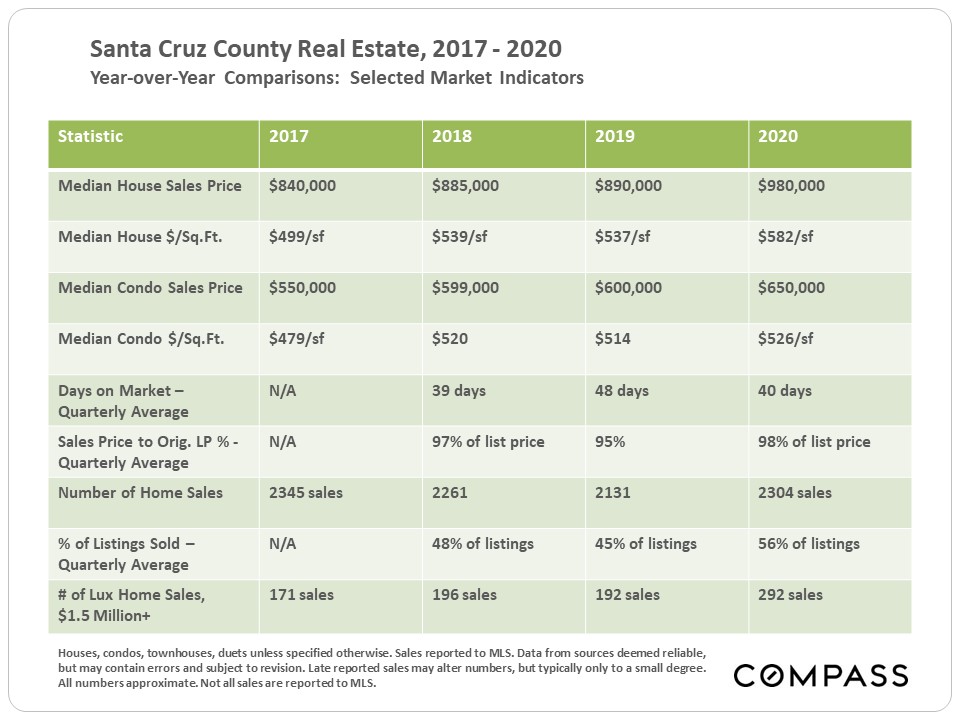 |
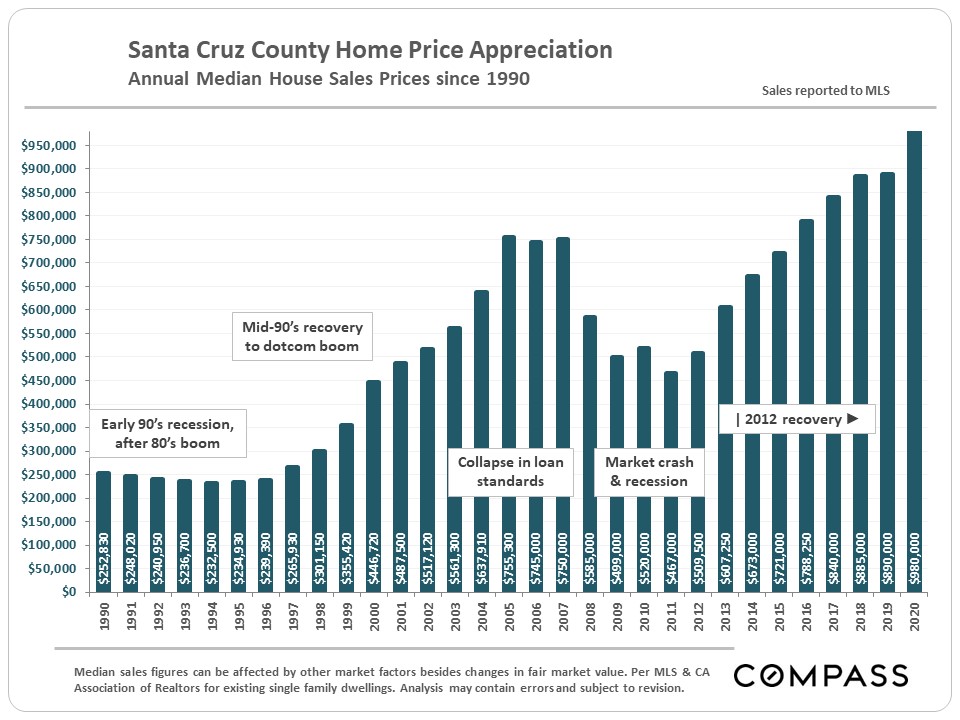
Next, check out this graph showing home price appreciation in Santa Cruz County since 1990. As you can see, the median price in Santa Cruz County was considerably higher than any year in the past 30.
 |
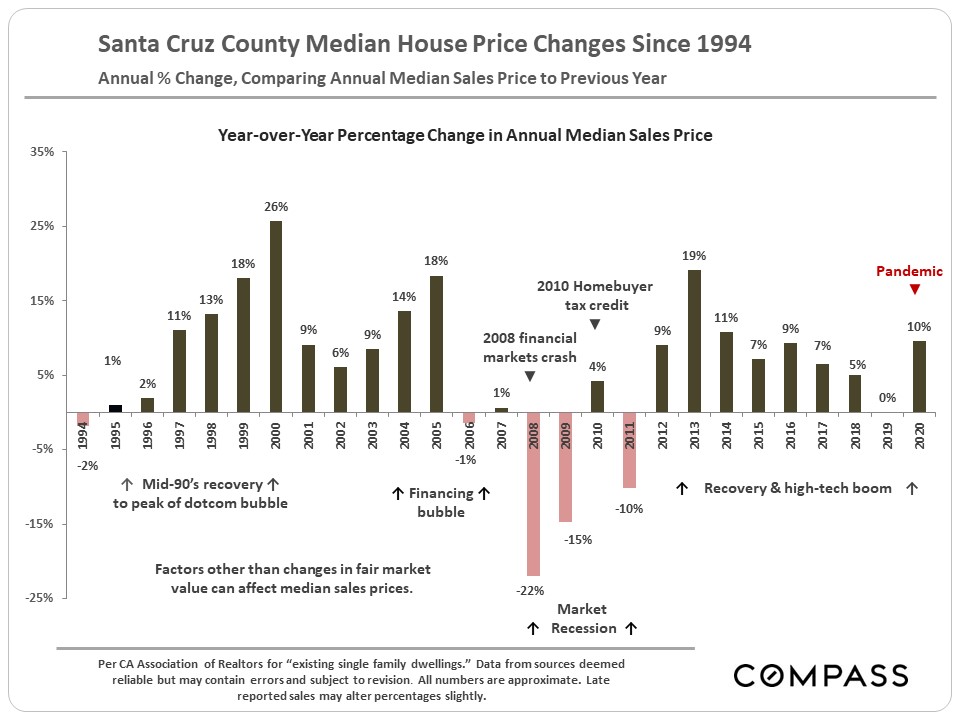
Next, take a look at yearly home price increases in Santa Cruz County since 1994. Prices were up 10% in Santa Cruz county in 2020 compared to the year before – where prices were flat year over year. It’s worth nothing that while 10% is a healthy increase, it’s by no means record setting or even much higher than average.
 |
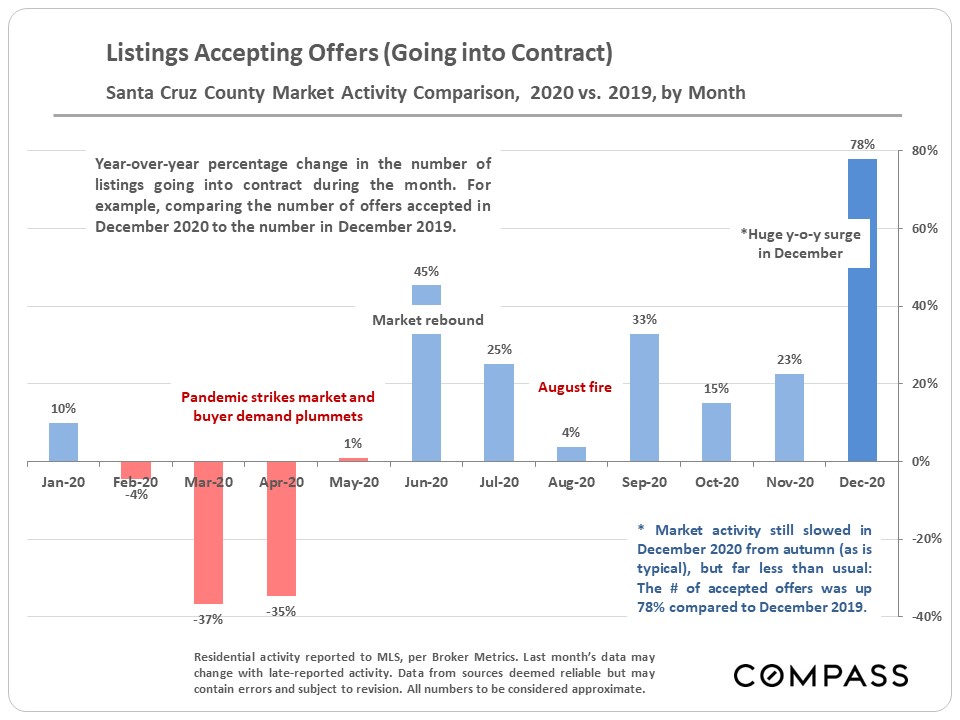
One startling aspect of 2020 was the ease sellers experienced getting their homes actually sold, irrespective of price. This next chart shows the huge jump in the percentage of listed homes going under contract, broken down by month. You cans that the early pandemic months showed a drop but December showed a massive increase in listings going under contract.
 |
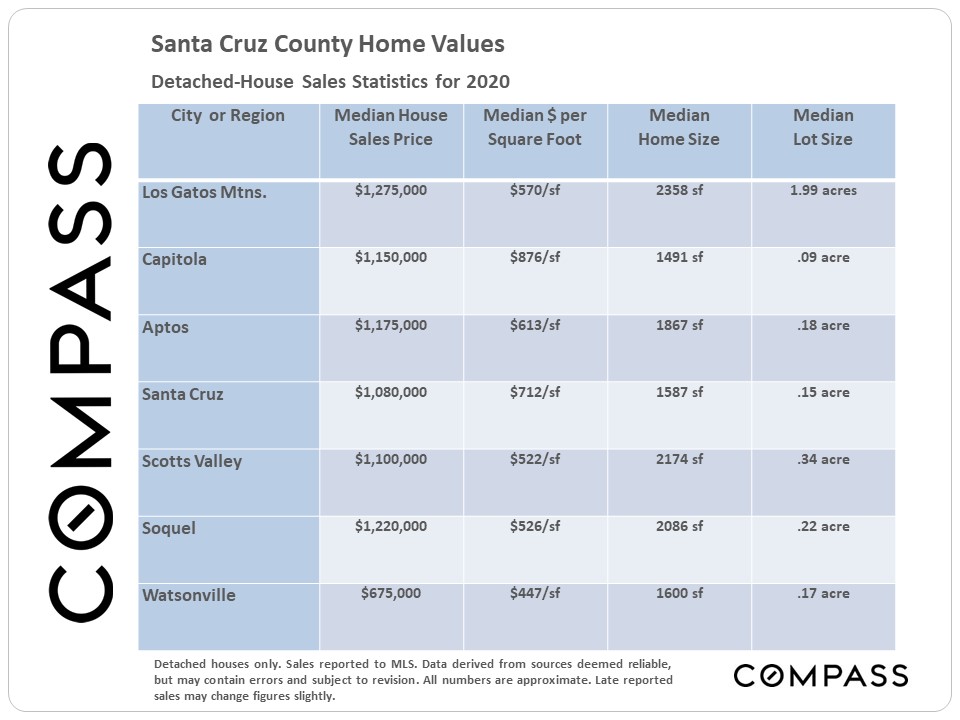
The following chart breaks down a number of statistics for single-family home sales in Santa Cruz in January 2020, broken down by region. Check out the price per square foot, which is a measure that I track closely. Note the negative correlation between median square footage and median price per square foot (the higher the square footage, the lower the price per square foot).
 |
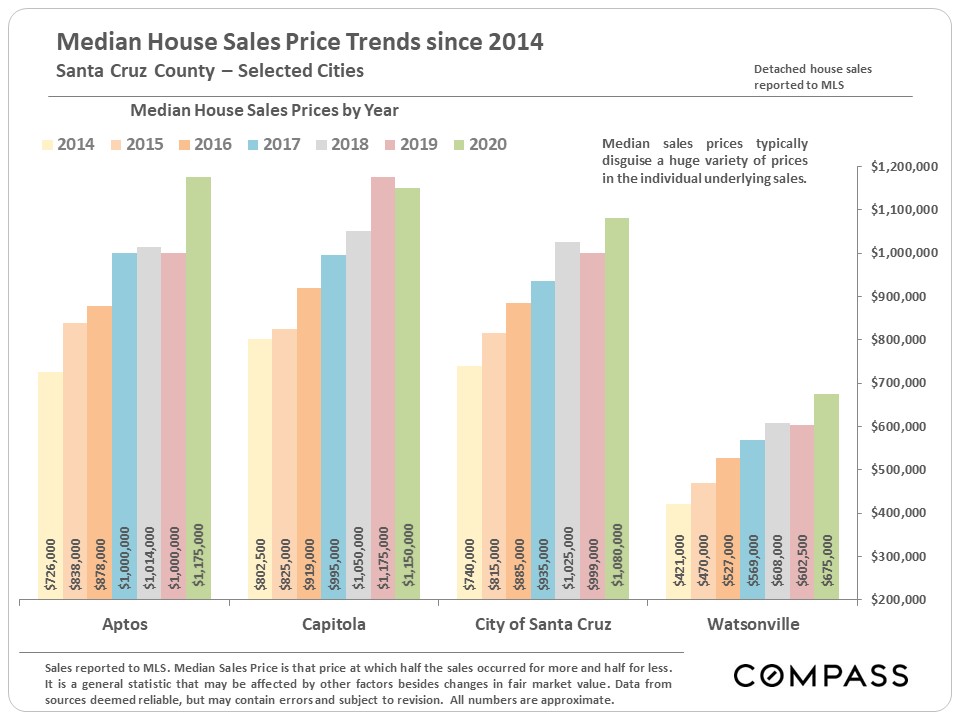
Here’s another breakdown of home price trends in Santa Cruz County since 2014, looking at four specific areas: Aptos, and the cities of Capitola, Santa Cruz, and the city of Watsonville.
 |
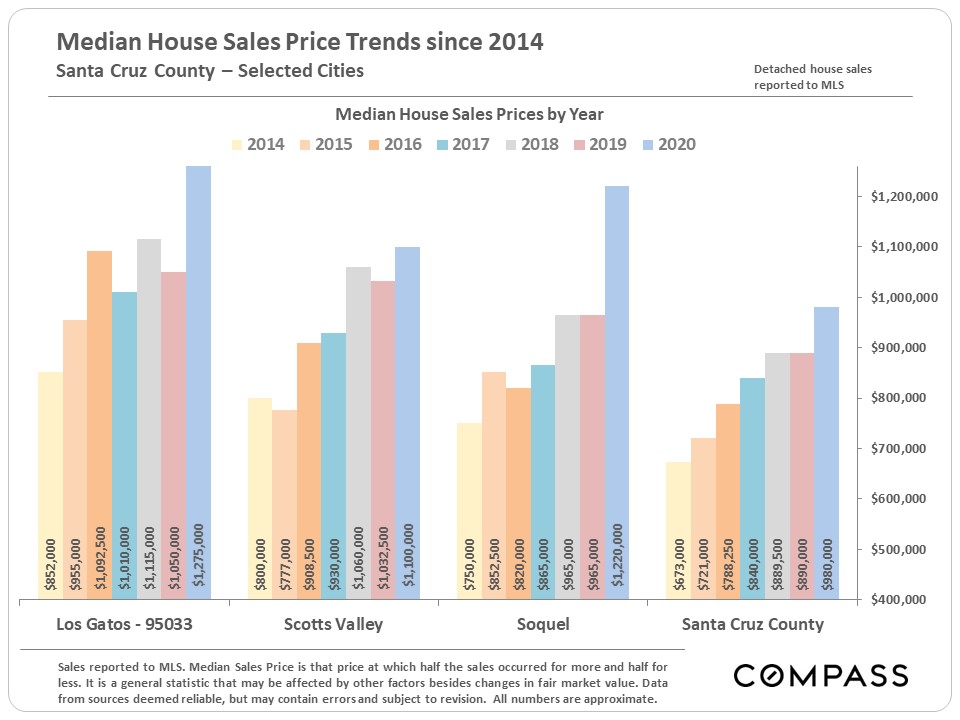
Here’s yet another breakdown of home price trends in Santa Cruz County since 2014, looking at four specific areas: the Los Gatos mountains, Scotts Valley, Soquel, and the whole of Santa Cruz County.
 |
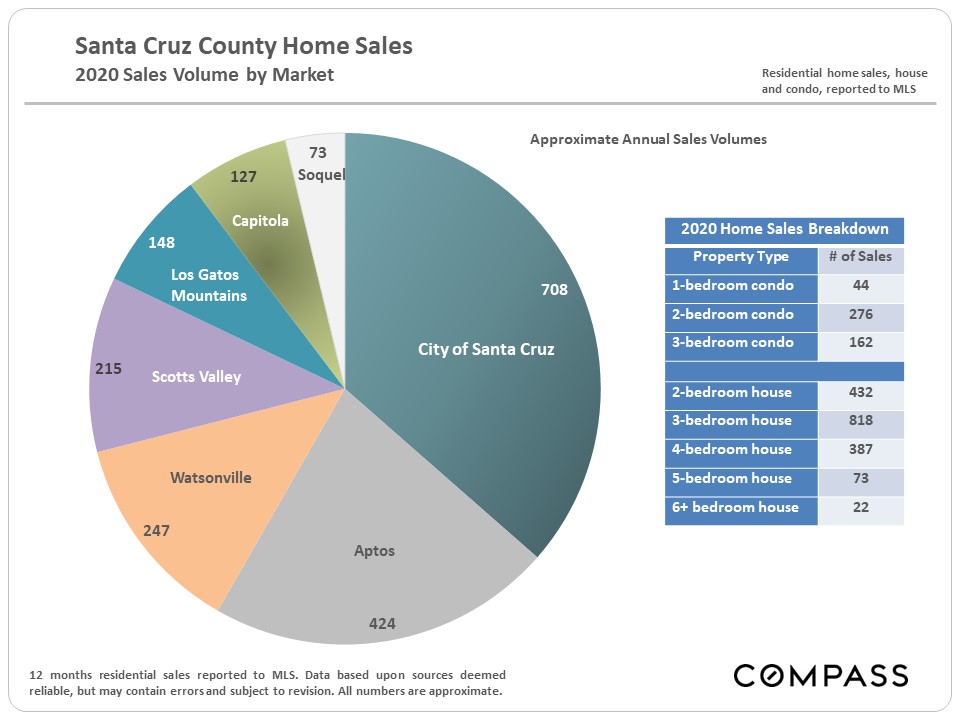
Next, a look at where homes sold in Santa Cruz County. As you can see, the city of Santa Cruz had the lion’s share of home sales, with Scotts Valley and Watsonville nearly identical in terms of homes sold. Aptos was unusually active as well.
 |
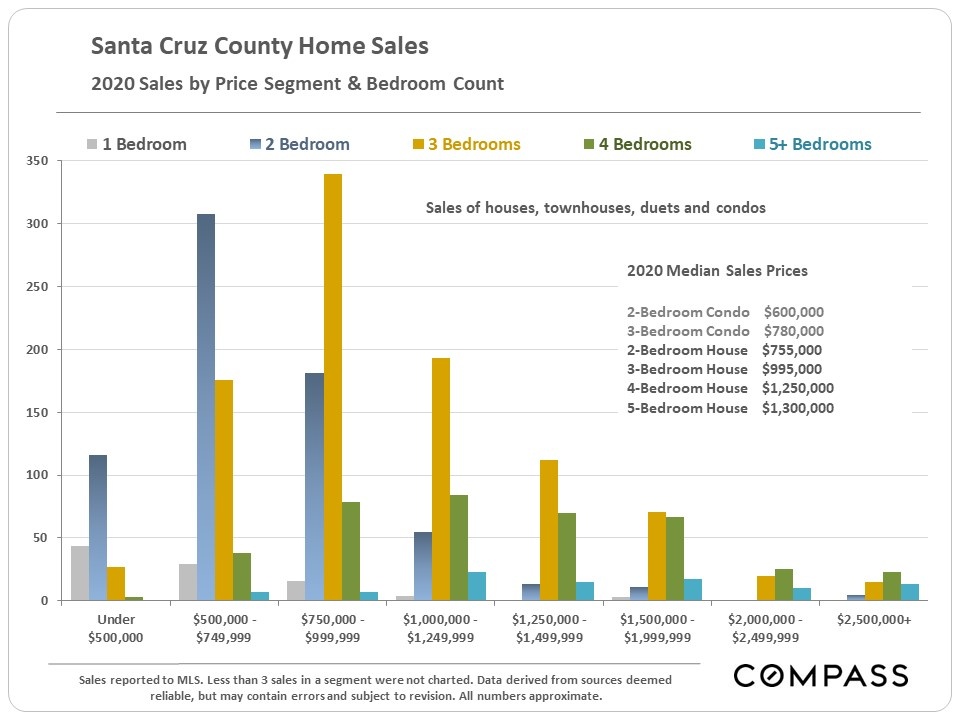
In the chart below, you can see that the home sales in Santa Cruz County were up year over year in most months. In most months, the increase was considerable, with the exception of the early pandemic months and the dreadful fires in August.
 |
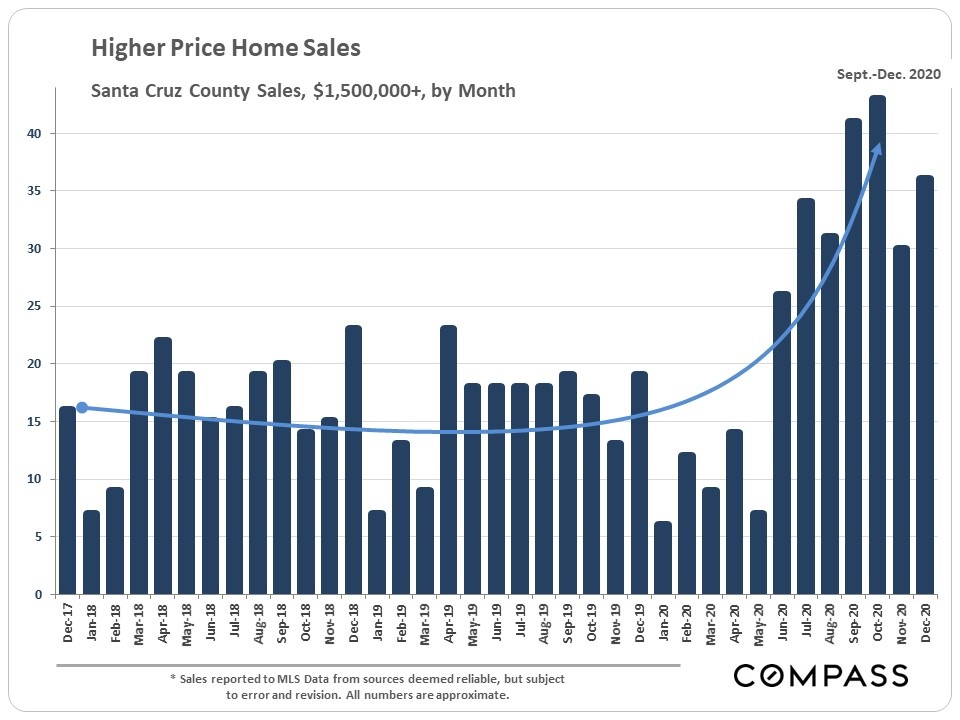
Looking at the upper end of the market (sales over $1.5 million) we can see that there was a dramatic increase in upper-end sales in 2020 compared to the two years prior.
 |
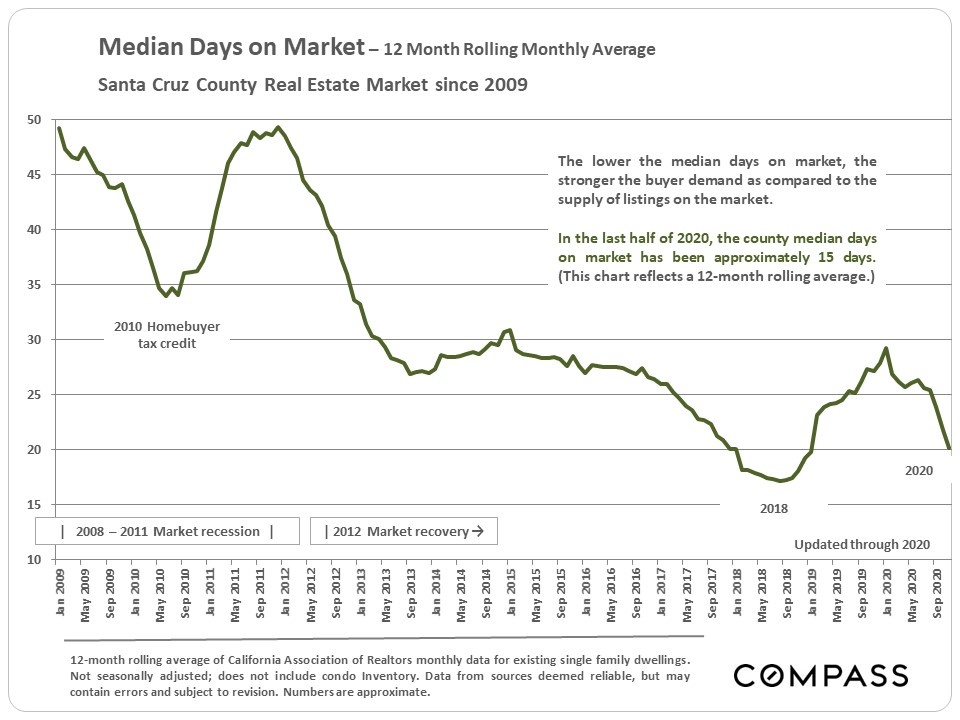
Another eye-popping chart shows the median days on market, and how it has gone down since the depths of the 2008 financial crisis. While the days on market was very low in 2020, it was still higher than several years in recent memory.
 |
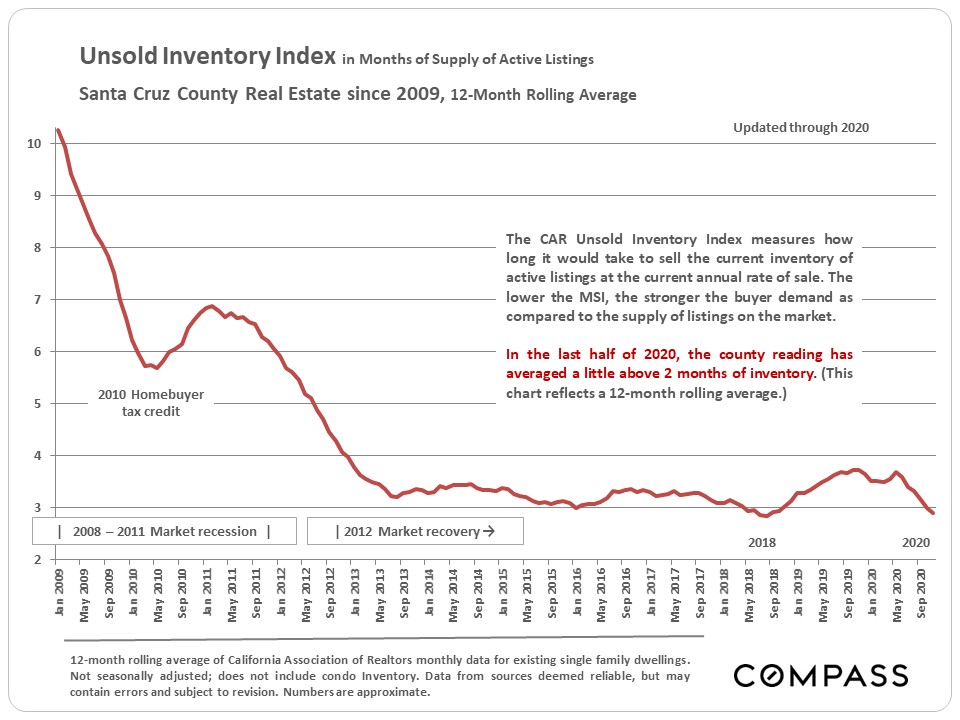
The unsold inventory index shows how many homes are available for purchase relative to how many homes are sold. The chart shows that the index is about as low as it’s been in the lat 11 years (and probably ever).
 |
Looking back at 2020 as a whole, it is clear that the Santa Cruz County real estate market defied all expectations. The question many readers will have now is: what will the 2021 real estate market be like? Look for me to address that question in future posts here on this site.


