Date Published: September 14, 2023
The Compass number crunchers are at it again, and they’ve updated their Dangers of Overpricing charts. They first released this data about a year ago, and it was a real eye-opener to me, and to all my clients that I shared it with.
Their study of overpricing last year showed that Bay Area homes which required at least one price reduction before going under contract sold for an average of 8% less than those homes which required no reductions.
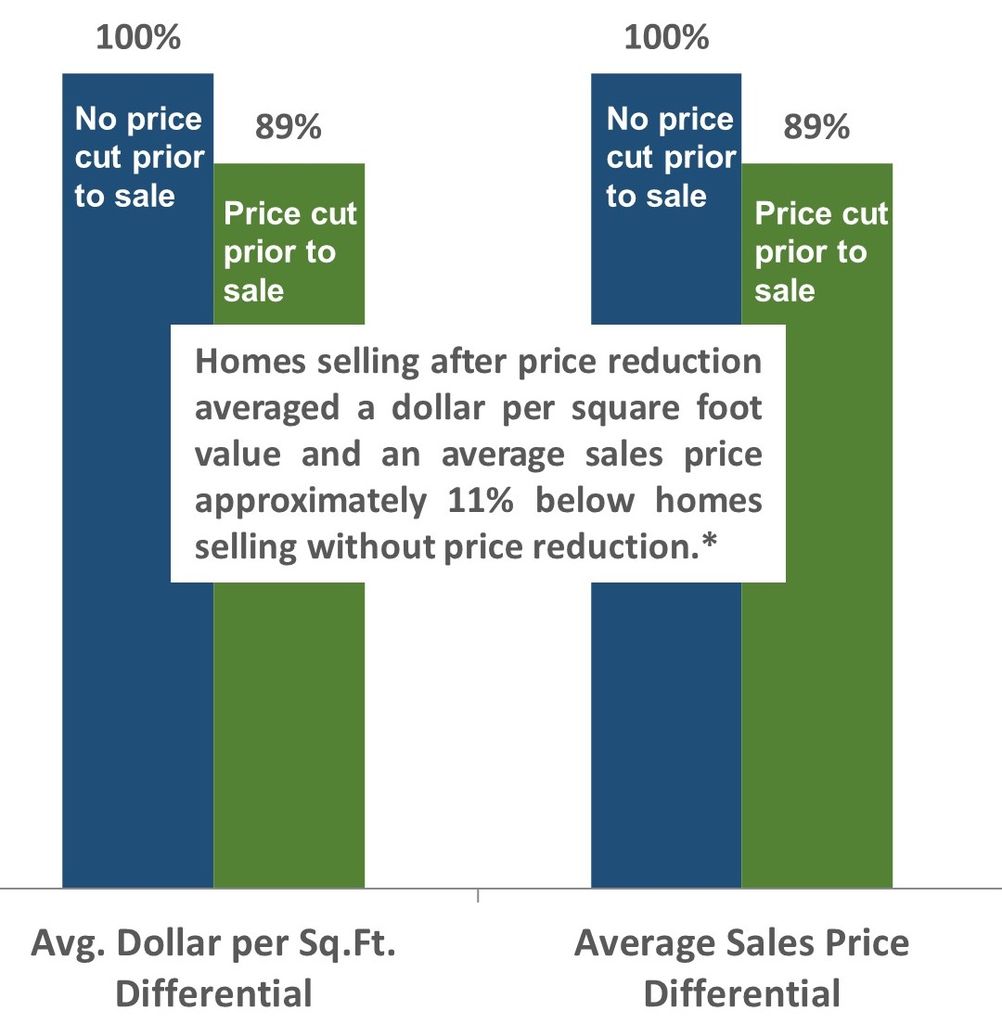
However, in the newest study they’ve just completed…they found that the gap has widened…to an average of 10% lower sale price per-square-foot for Bay Area homes which had at least one price reduction. The chart below is for Santa Clara county – which actually shows an 11% gap.

Risk of Overpricing your Home Chart
That means for a home valued at $1.5M, overpricing it could reasonably (and statistically) be expected to cause it to sell for only $1,350,000. That’s a $150,000 haircut!
Ever since Compass first released this data a year ago, I’ve thought more than ever about the risks of overpricing….and the benefits of underpricing.
For many years (most of my real estate career, actually) I’ve told my clients that they’ll get more money by underpricing their homes versus pricing them at “fair market value”…or over fair market value.
But strangely, I’d never personally crunched the numbers…until this week. What I discovered was pretty shocking. Now, I’ll grant you that I did a limited study (more more limited than the Compass studies about overpricing) but I’m pretty sure you’d find the same results more-or-less regardless of whichever data set you’re looking at.
I looked at all closed sales of single-family homes in the city of San Jose in July of 2023. I divided the sales into three groups:
- Homes that sold below the original list price (overpriced)
- Homes that sold exactly at the original list price (precisely priced)
- Homes that sold over the original list price (underpriced)
And would you believe…that homes which were overpriced sold for an average of 10.4% less per square foot than homes which were “precisely priced”? You probably can believe that, because it aligns closely with the Compass data.
But what’s really interesting is when we look at underpriced listings…underpriced listings sold at a 3.6% premium versus homes which were priced “exactly correctly” … but underpriced listings sold for a whopping 15.5% more per square foot than overpriced listings.
For a $1,500,000 house that could mean you’d make $232K more by underpricing versus overpricing.
In a word: wow.
Prime Condos & Townhomes for Sale in Silicon Valley
2
3
4
5
6
7
8
9
10
11
12
13
14
15
16
17
18
19
20
21
22
23
24
25


