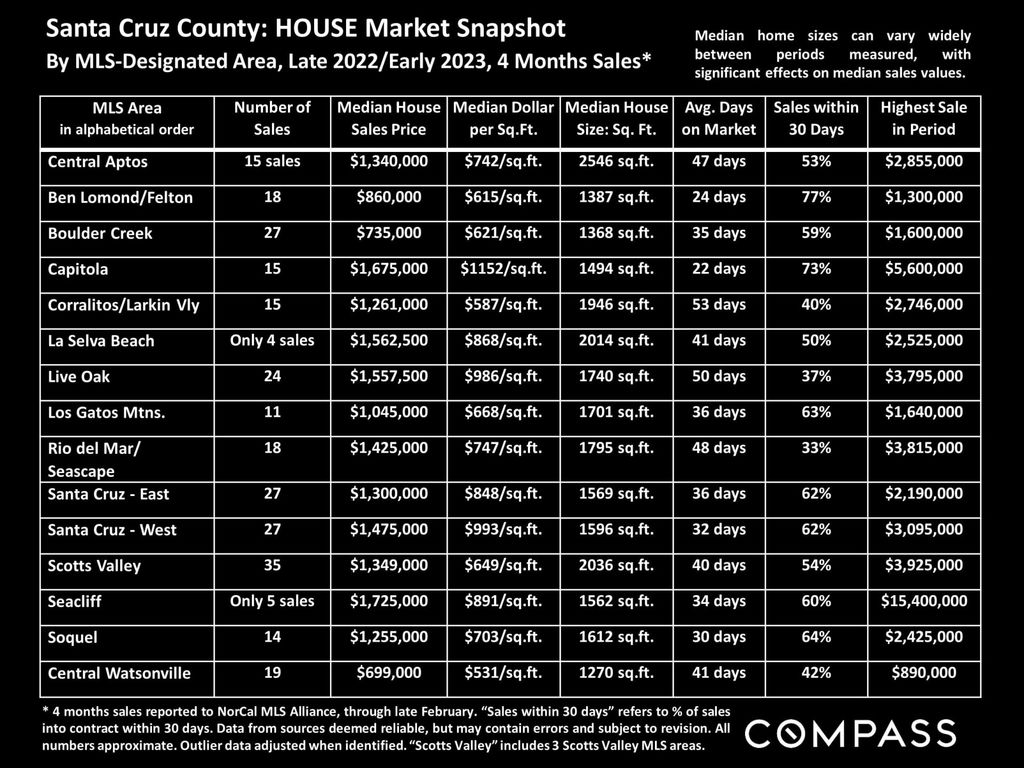
Despite a sharp decrease in the first half of 2022, the market saw a noteworthy uptick in buyer demand in the first few months of 2023, and many market indicators have turned positive.
Anecdotally, the number of people who visited an open house, the number of offers received, the amount of money bid vs. list price, and absorption rate (how many homes are purchased relative to newly listed homes) all increased.
It’s too soon to tell if this will have any significant, lasting impact on housing values. The latest housing numbers show that the February 3-month moving average of median home sales price in the Bay Area fell in every county in the region. Such percentage drops warrant skepticism until they can be verified over a longer period of time.

Although year-over-year indicators have improved since late 2022, they are still below where they were a year ago due to comparisons with the extremely buoyant conditions that prevailed at the Q1 2022 pinnacle of an 11-year upcycle in the housing market.
In February, the market built on the momentum it began to recapture in January. A wealth of new information on availability, demand, and pricing trends will soon be available, as March through May is traditionally the busiest listing and sales season of the year. These will be critical months to watch.
For the past three years, the start of the epidemic (2020), the pandemic boom (2021), and rising interest rates have all had profound effects on the spring market, albeit in very distinct and frequently unexpected ways (2022).
Despite declining significantly in January from a peak in November, interest rates surged again in February, having a significant influence on the number of loan applications submitted.

Predicting fluctuations in short-term interest rates has proven extremely difficult. The drastic drop in the supply of homes for sale over the past year is another important aspect.
Of course, I would be remiss if I didn’t mention the collapse of Silicon Valley Bank which has been much in the headlines. It appears that the Feds moved adroitly to avert what could have been a disaster for many local firms. But damage has been done, as it seems that consumer confidence has been shaken by it…and consumer confidence is what’s needed to keep buyers writing juicy offers even in the face of stiff interest rates.
Before I dig into the actual numbers, I want to touch on inventory. The crippling lack of homes for sale has been driving the real estate market locally for at least the past 5-6 years. The data show that new inventory in February was down dramatically from February 2022. If that were to change, it’s not hard to imagine a future where the supply/demand imbalance would slide decidedly into a buyer’s market.
But what might drive an increase in inventory? In a word: layoffs. Jobs – especially well-paying tech jobs – drive demand for expensive housing in the area. It seems that every week there’s news of additional layoffs. This week I’ve read that Facebook plans another 10,000 job cuts.
If this keeps up, expect to see a double-whammy of homeowners selling while the buyer pool dwindles. It’s too soon to know if this is a longer-term trend that really will drag down the market
February 2023 Santa Clara County Real Estate Report

Download the complete set of Santa Clara County numbers here.
February 2023 Santa Cruz County Real Estate Report

February 2023 Monterey County Real Estate Report


