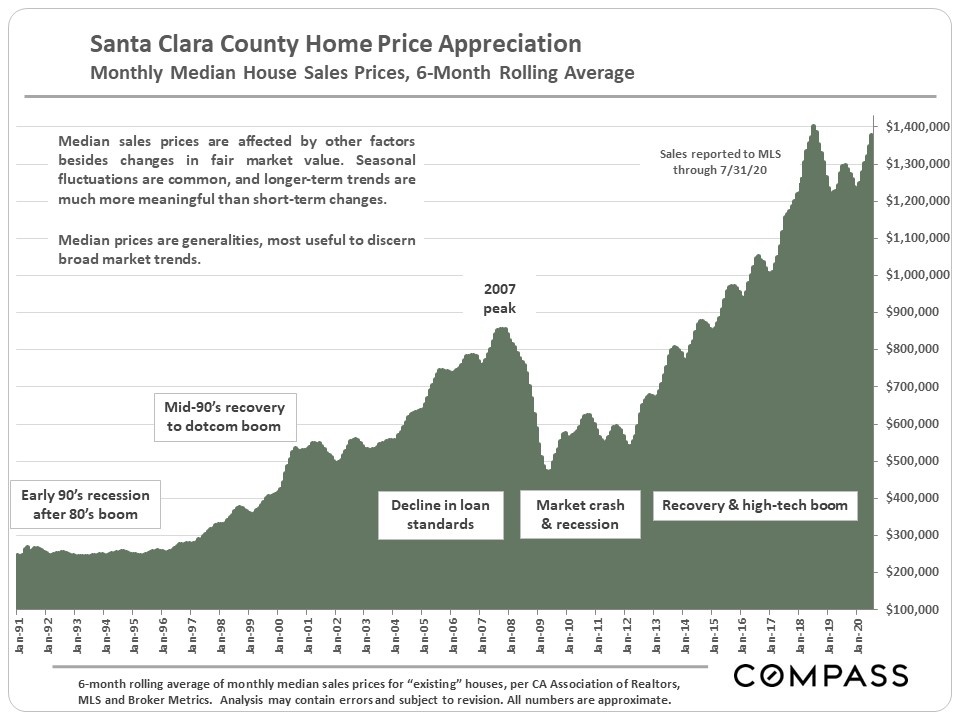
Median House Sales Price – Long-Term Trends
 |
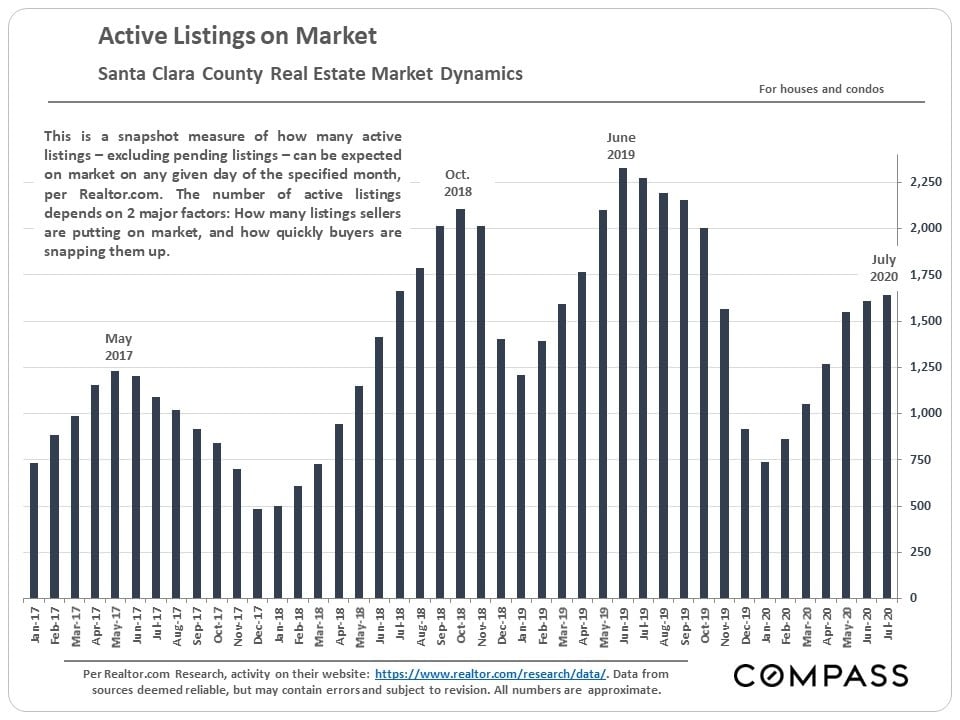
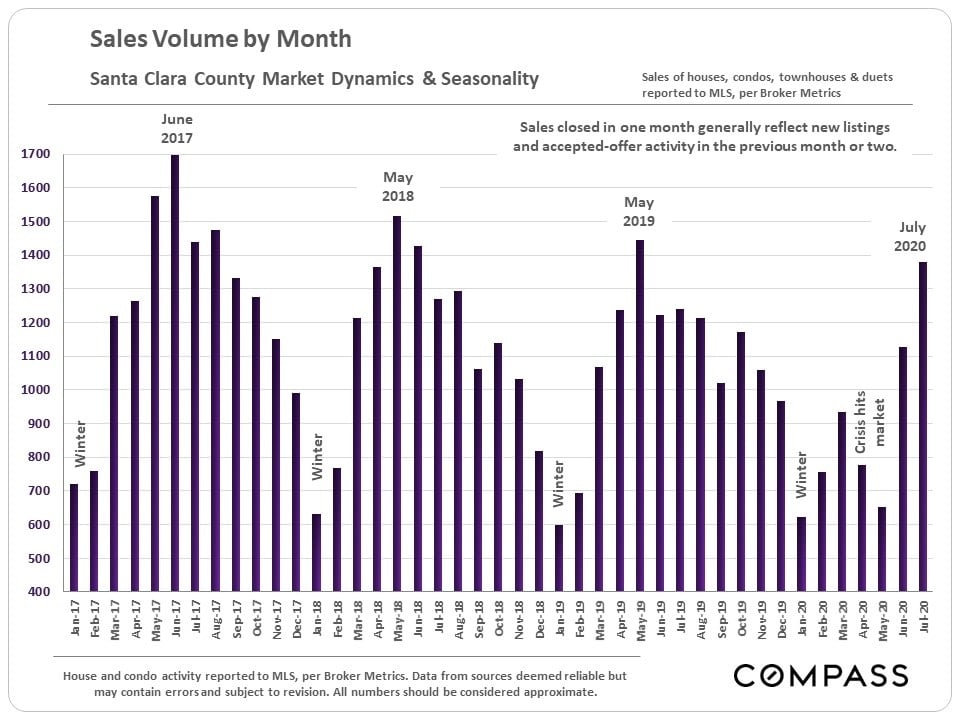
Supply & Demand
The number of active listings remains low.
 |
 |
 |
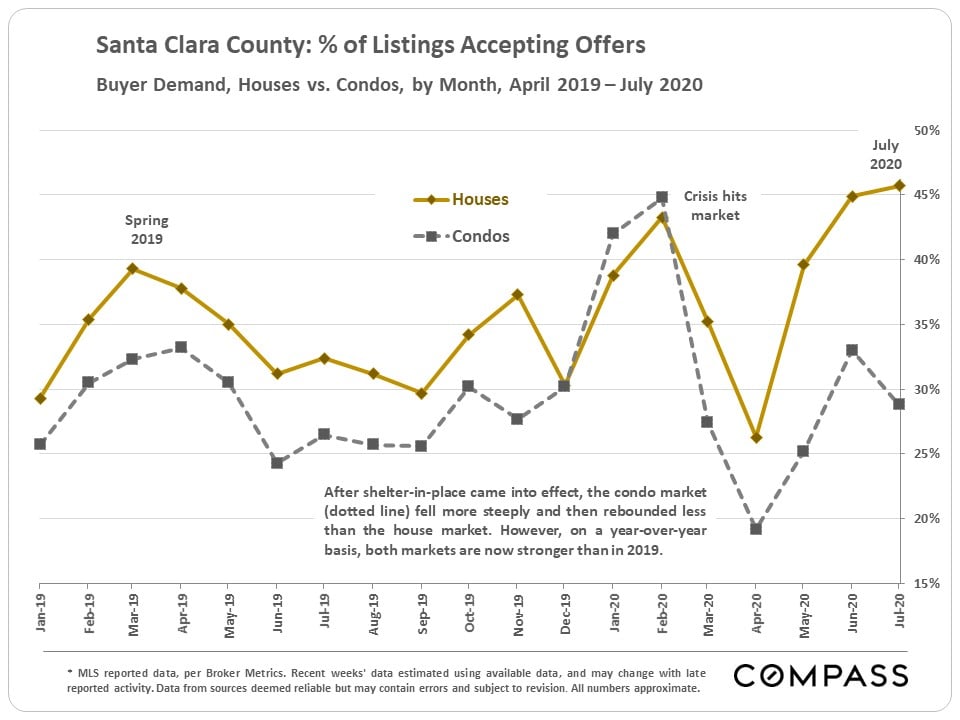
House vs. Condo Markets
As is not uncommon in other Bay Area Counties, the condo market is substantially softer.
 |
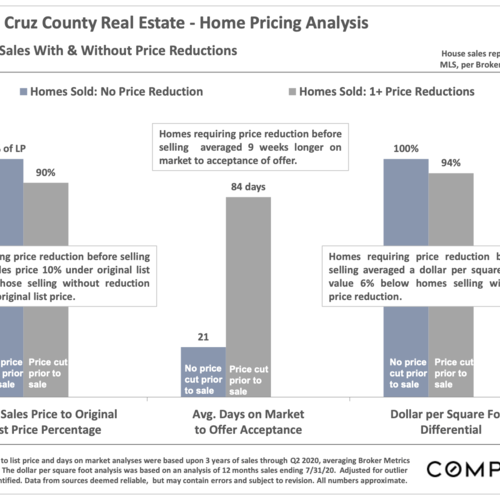
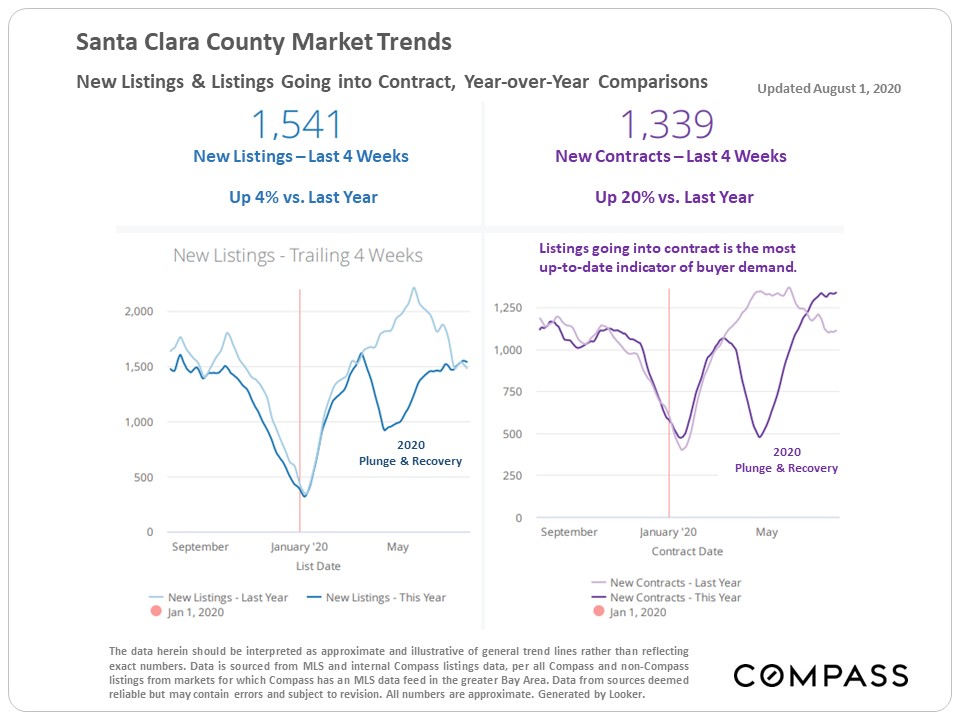
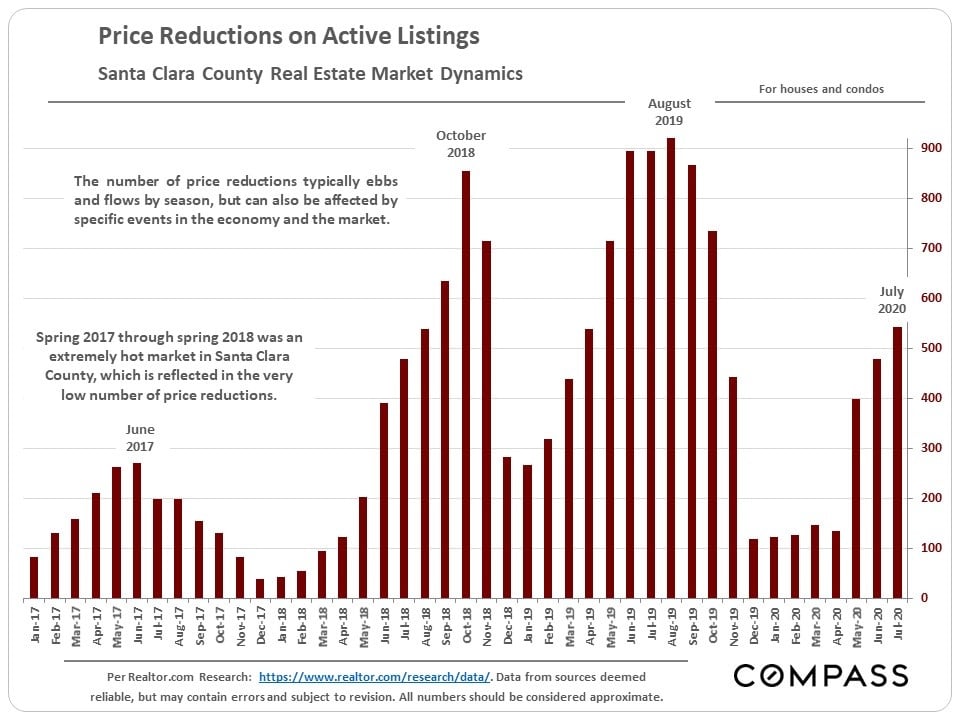
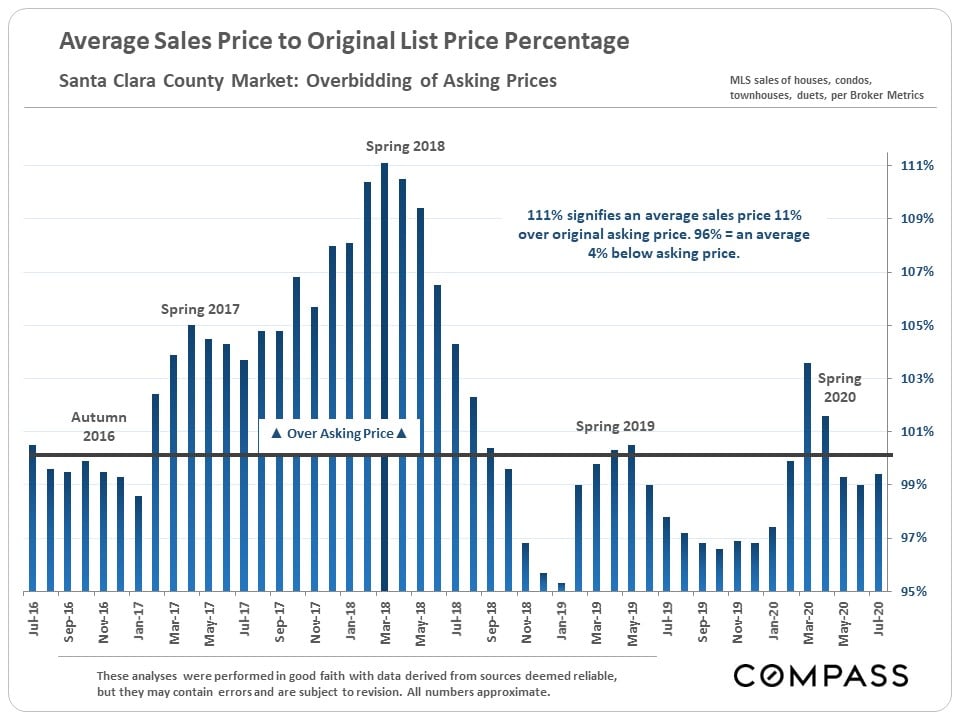
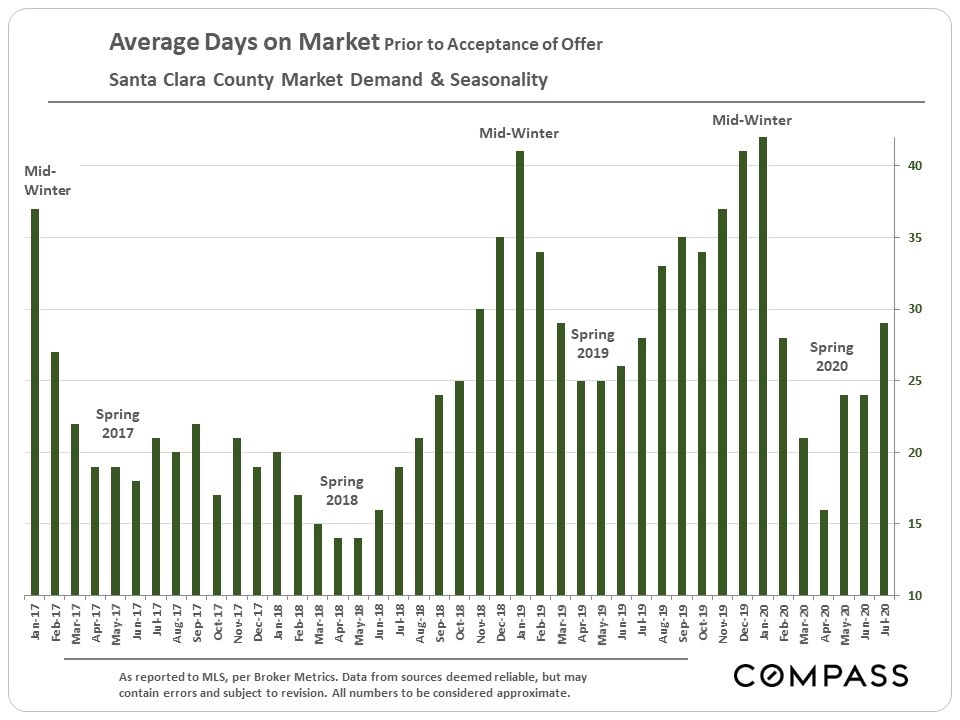
Selected Market Indicators
Year-over-year, the number of price reductions remains moderately low (chart 1); the average sales-price-to-list-price percentage is down from the heights two years ago (chart 2); and average days on market, though climbing a little, also remain moderately low (chart 3).
 |
 |
 |
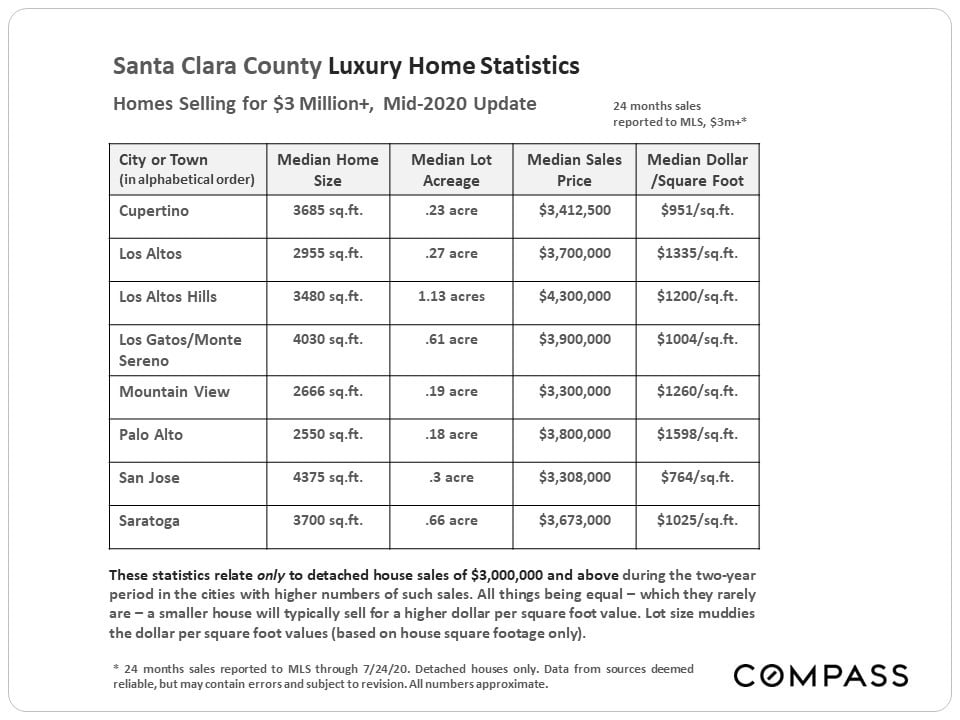
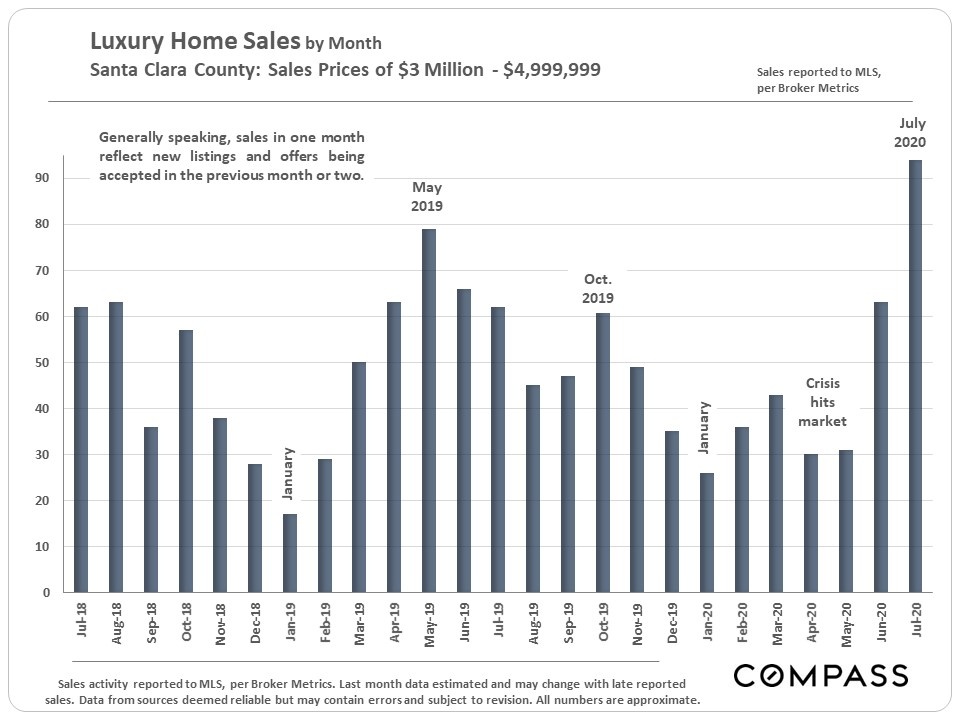
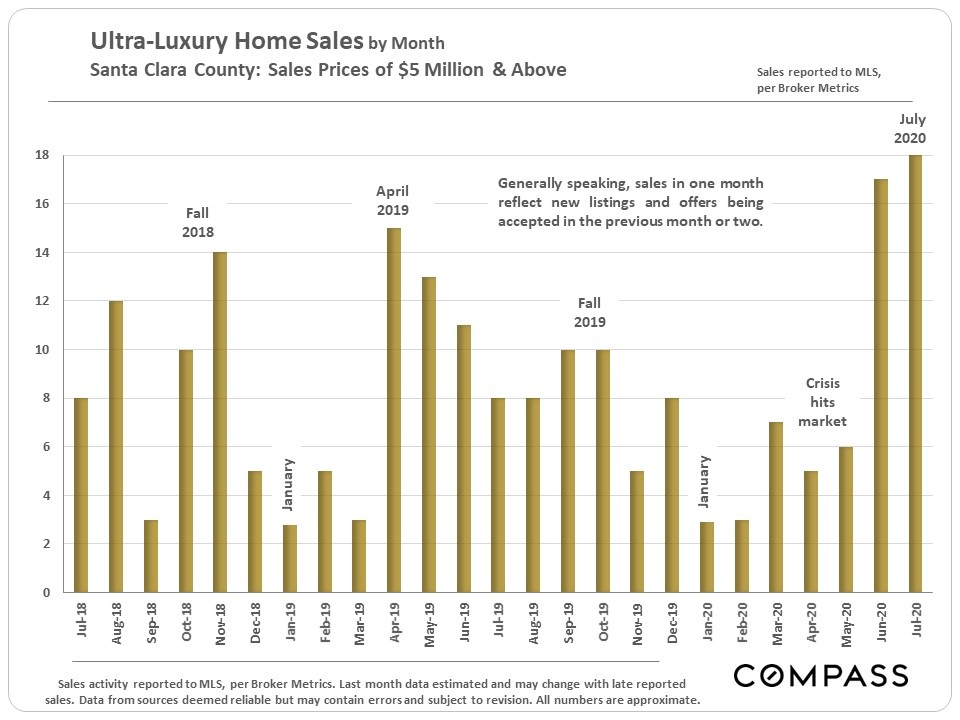
Luxury Home Sales
A comparative table on homes selling for $3,000,000+
 |
Substantial spikes in higher-price home sales
 |
 |
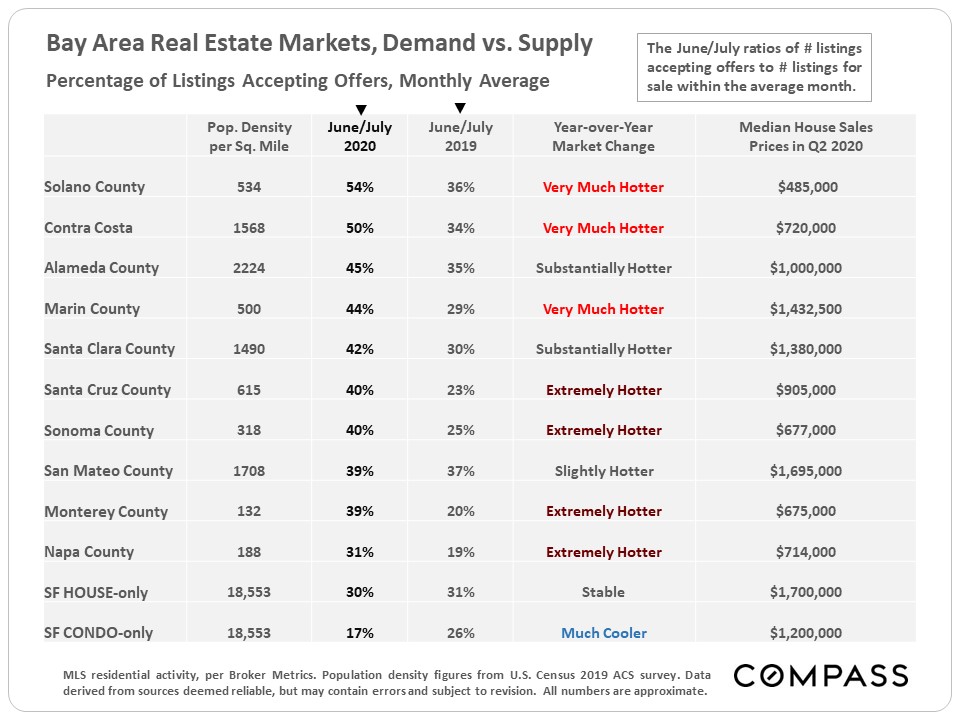
Bay Area County Markets Comparison
This table ranks each county by the percentage of active listings going into contract in June/July 2020 – a standard statistic of market heat – compares it to the same period of last year, and then rates the year-over-year change. The Santa Clara County market is substantially hotter than last year, but some other Bay Area counties – especially outlying, more rural counties – are seeing huge year-over-year increases in demand.
 |
Time to talk to a REALTOR?