Has the Santa Cruz real estate market peaked? That’s a question I was asked last month by the Santa Cruz Sentinel.
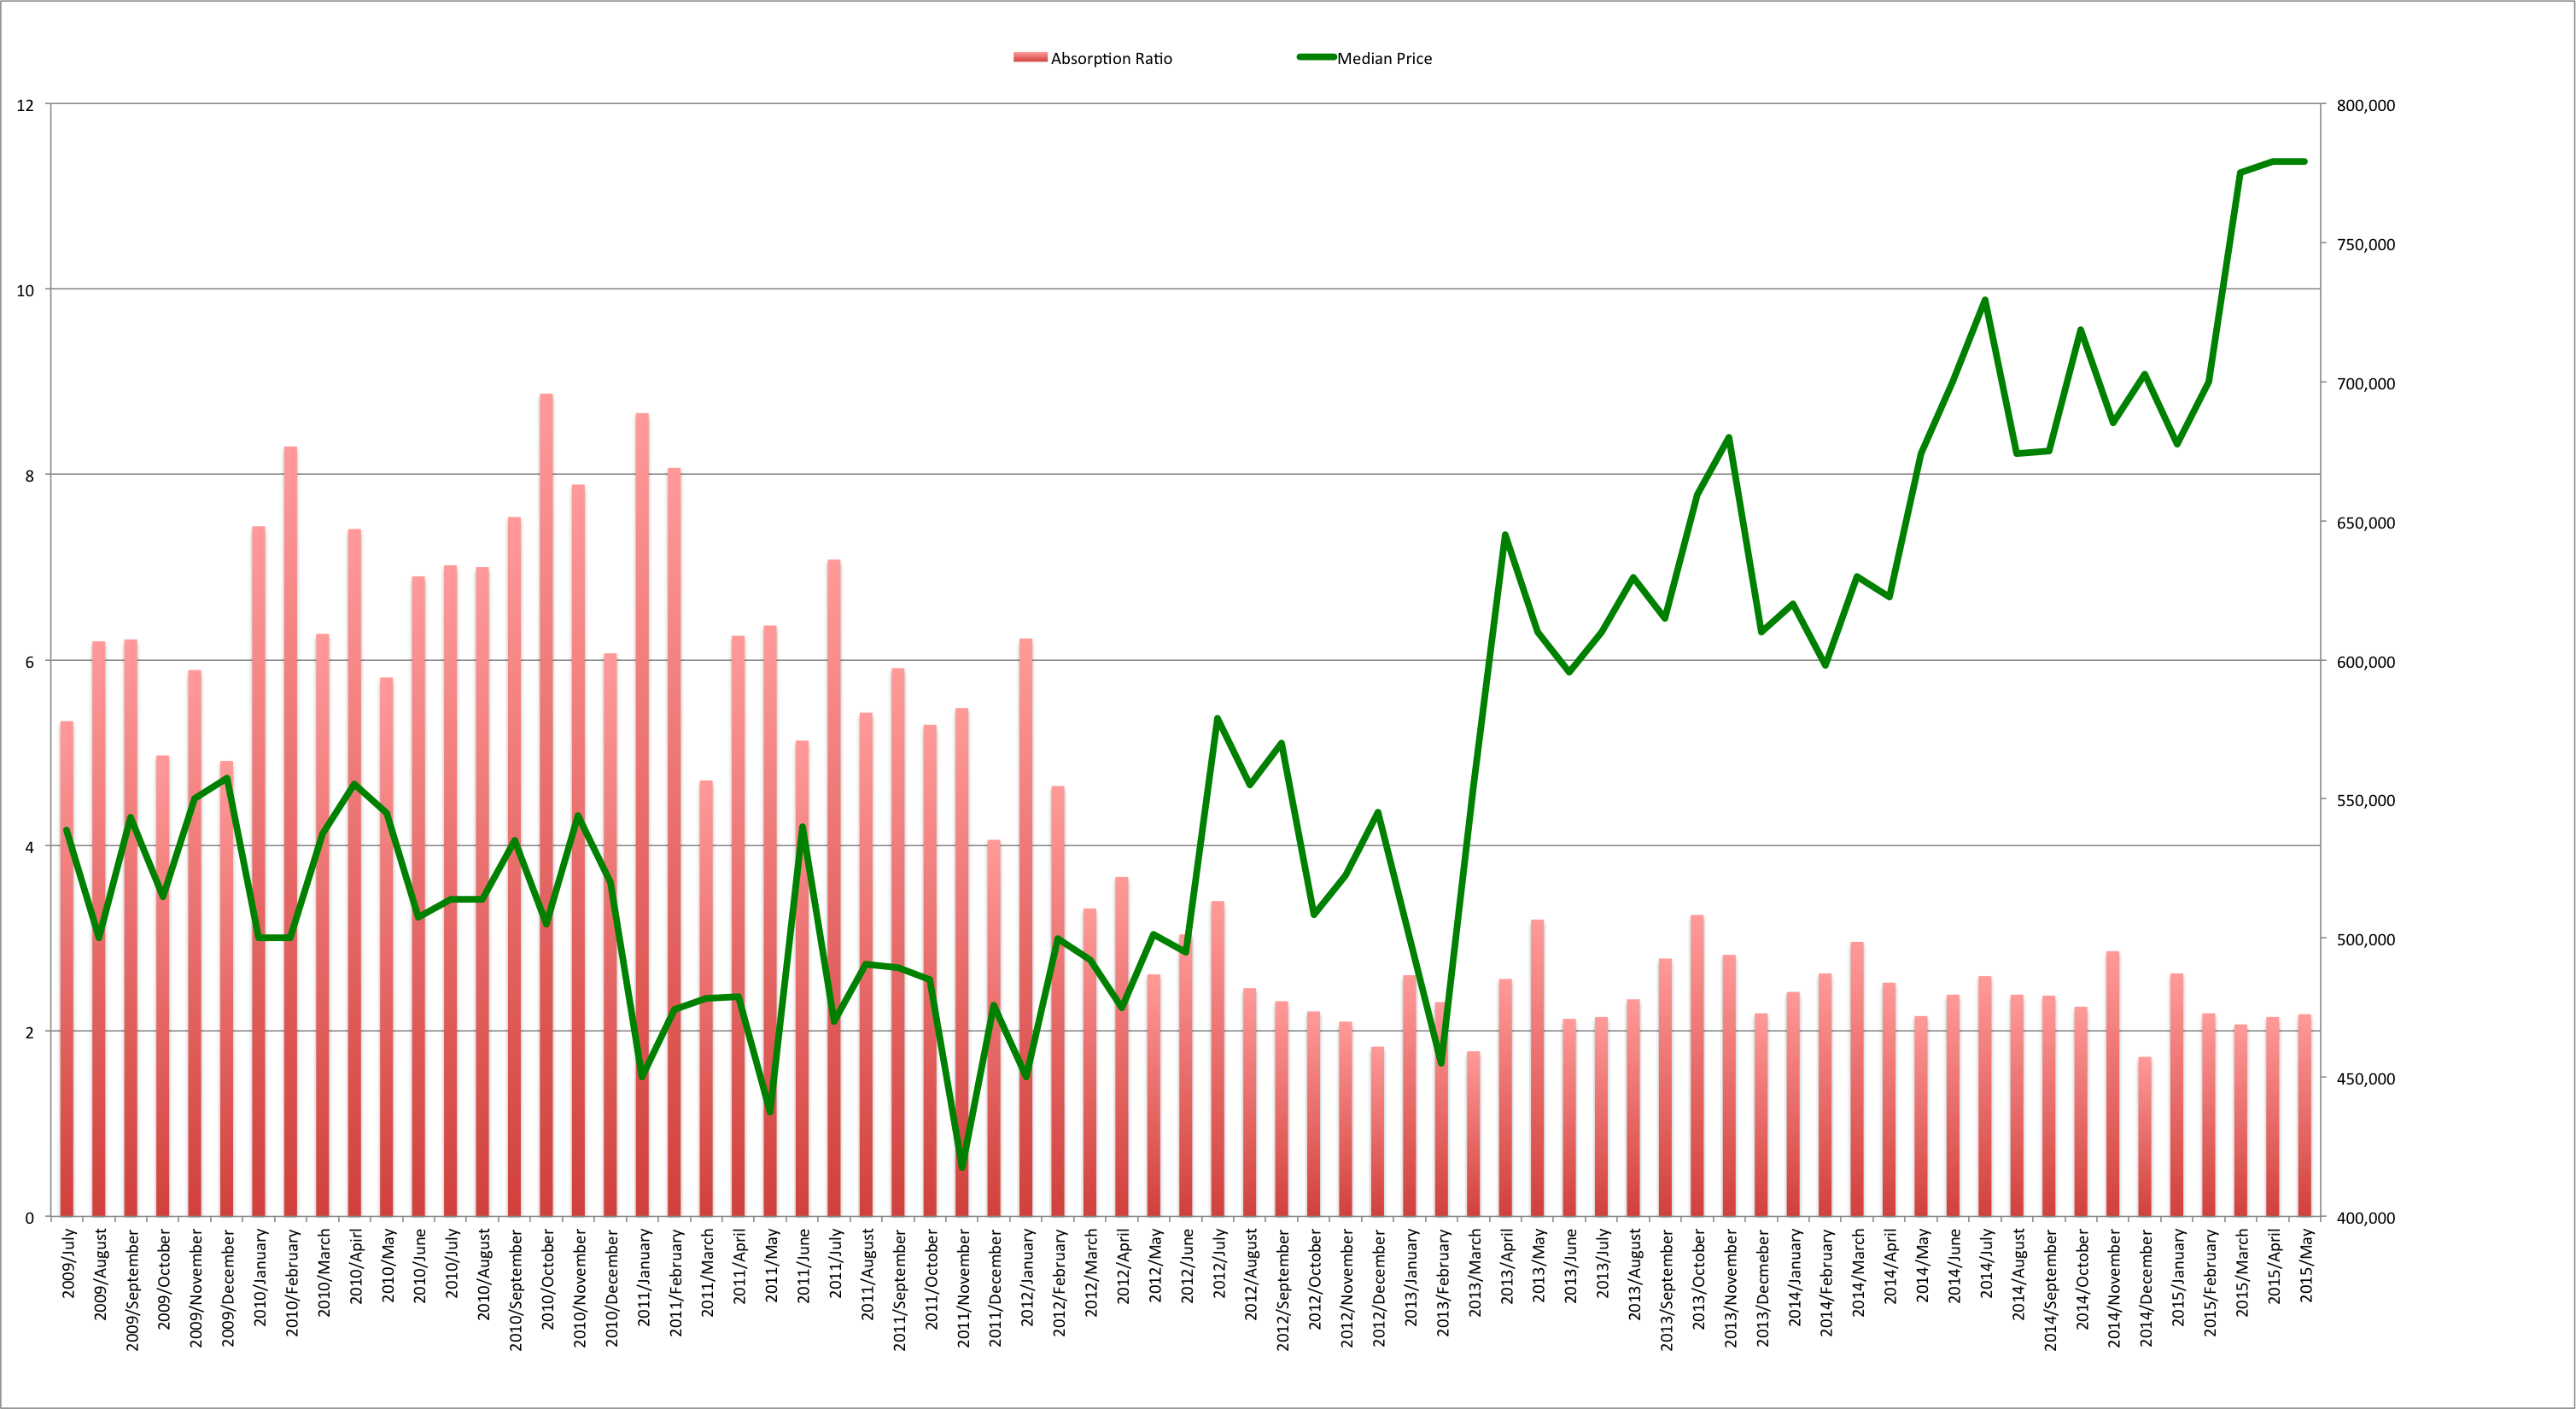
In a word: it’s too soon to tell. The market has peaks and valleys, and sometimes it has plateaus, too. In October 2014, the Santa Cruz real estate market appears to have hit a plateau, with the median price coming in at $675,000 – which is a scant $1,000 higher than the previous month, or just 0.15%. When you look at this chart, you can see what may be the beginning of a plateau:
At this point, the highest prices of the year were recorded in July when the median price hit $729,000, and it dropped to $674,000 in August, and now $675,000 in September. Interestingly enough, you can see that the absorption ratio was virtually unchanged in August and September, indicating that the balance between supply and demand was virtually identical in that time period as well.
I would, however, be remiss if I didn’t point out that the market is still up considerably over last year: that $675,000 median price is up 9.8% from a year ago, when the median price was $615,000.
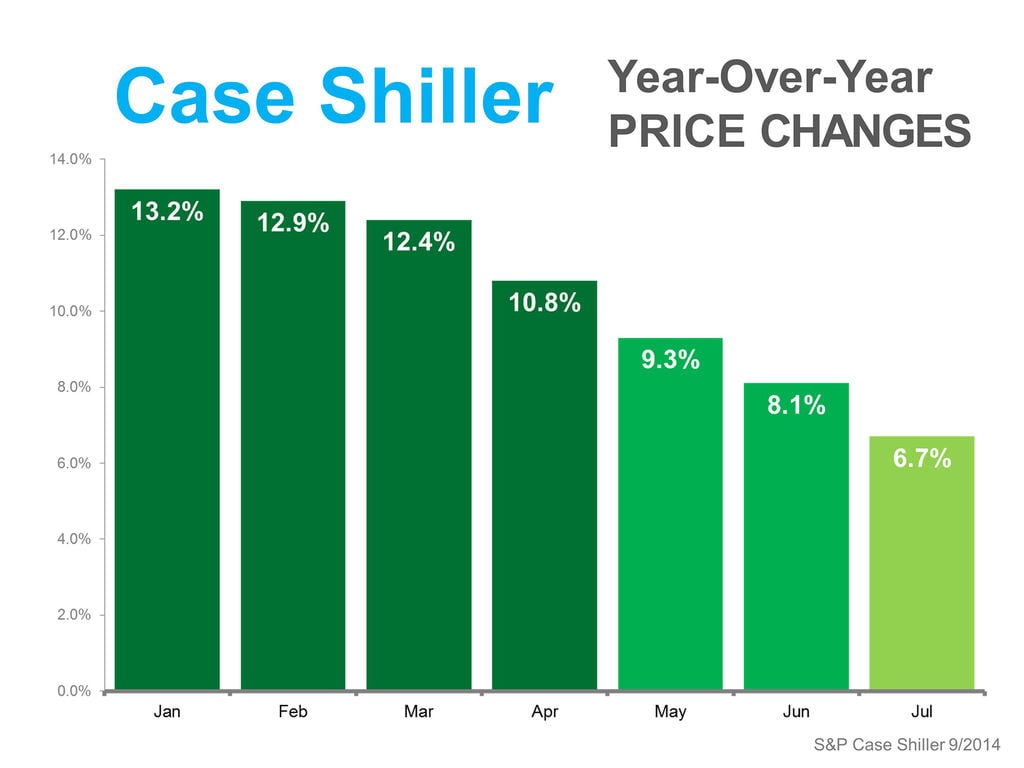
This is not just a local phenomenon. Check out this graph below, which shows the percentage of year-over-year price changes on a national basis. This data comes from the Case Shiller September Report. It shows clearly that prices are still increasing year-over-year, but they are increasing by less and less as the year has gone by:

Case Shiller Year over Year Price Increases
While the healthy price increases seem to be tapering off, the number of homes that were sold increased in September, with 195 closings. This is up 3.2% compared to last year, and up about 6% from the month before. Actually, this is the largest number of home sales in over a year…the last time we saw sales this high was in July 2013, when 205 homes were sold.
While homes are selling at a brisker pace, it looks like sellers are having to do some discounting to make that happen: the sales-to-list-price ratio in September was 98.7%; that’s down from 99.8%, which is how much sellers got a year ago – and also in the prior month as well. Not only were sellers discounting their homes in September, they were also taking longer to sell them. Homes that sold took an average of 48 days to do so, which is an increase 41.5% from the month before, and 24.6% longer than a year ago.
Inventory continues to remain extremely tight, with just 464 homes available for sale at the end of September. This is an increase of about 5.5% from the prior month, but is only about 1.1% higher than a year ago. Given the higher sales volume, this works out to a 69 day supply of “available” inventory at the end of September, a 4.2% decrease from a month ago, and a 27.3% decrease in relative supply compared to a year ago.
So where is the market going as we head into the fall and winter? If I had to make a bet, I’d say we’re in for more of the same: low inventory and strong demand are going to work together to keep prices buoyed up. Not only that, but interest rates have gone back below 4% again (sinking to a 16-month low), which means buyers have more purchasing power than they did a couple-few months ago. Not only that, but Fannie Mae has had a change of rules, and borrowers can now get new mortgage loans just two years after bankruptcy, short sale, or foreclosure.
Even with lower rates and more boomerang buyers back in the market, the median price may well decline in the months ahead. My question is, will it decrease on a year-over-year basis? Prices have not decreased year-over-year since February 2013, when the median price was $455,000 (was it only 18 months ago?). The market hit a lull at the end of 2012, but by March 2013, we were back doing double-digit price rises. What are the odds history will repeat itself in 2014/2015? Watch this space!


