Every seller I sit down with asks some version of the same question: do we really have to move out before we list? For a longtime homeowner with 40 years of furniture, a spouse who doesn’t want to leave, or a parent still living in the house, moving out first is a huge ask. So instead of answering with my gut, I went to the data.
I pulled every single-family home sale in Santa Clara County that closed between January 1 and October 31, 2026, with a list price between $1 million and $3 million. That came to 4,874 sales, and 4,862 of them had an occupancy status entered in the MLS. I sorted them by whether the home was vacant, owner-occupied or tenant-occupied when it sold, then compared how fast they sold, how far over list they went, what they sold for per square foot, and what they sold for compared to similar homes in the same neighborhoods.
So should your house be vacant when you sell it? In most cases it helps, but not for the reason people think. Some of what I found confirms what agents tell sellers, and some of it flatly contradicts it. The short version is that moving out buys you speed, competition and certainty much more than it buys you a higher price, and if you have a tenant in the house, getting it vacant matters a lot.
Key Takeaways
Summary: An analysis of 4,862 Santa Clara County single-family home sales between $1 million and $3 million that closed January 1 through October 31, 2026 found that vacant homes sold at 104.9% of list price compared with 102.1% for owner-occupied homes and 99.4% for tenant-occupied homes. Vacant homes drew more offers and were less likely to sit, but comparable vacant and owner-occupied homes sold for about the same final price. Tenant-occupied homes sold for about 8% less than comparable homes.
Vacant Homes Sold Further Over Asking
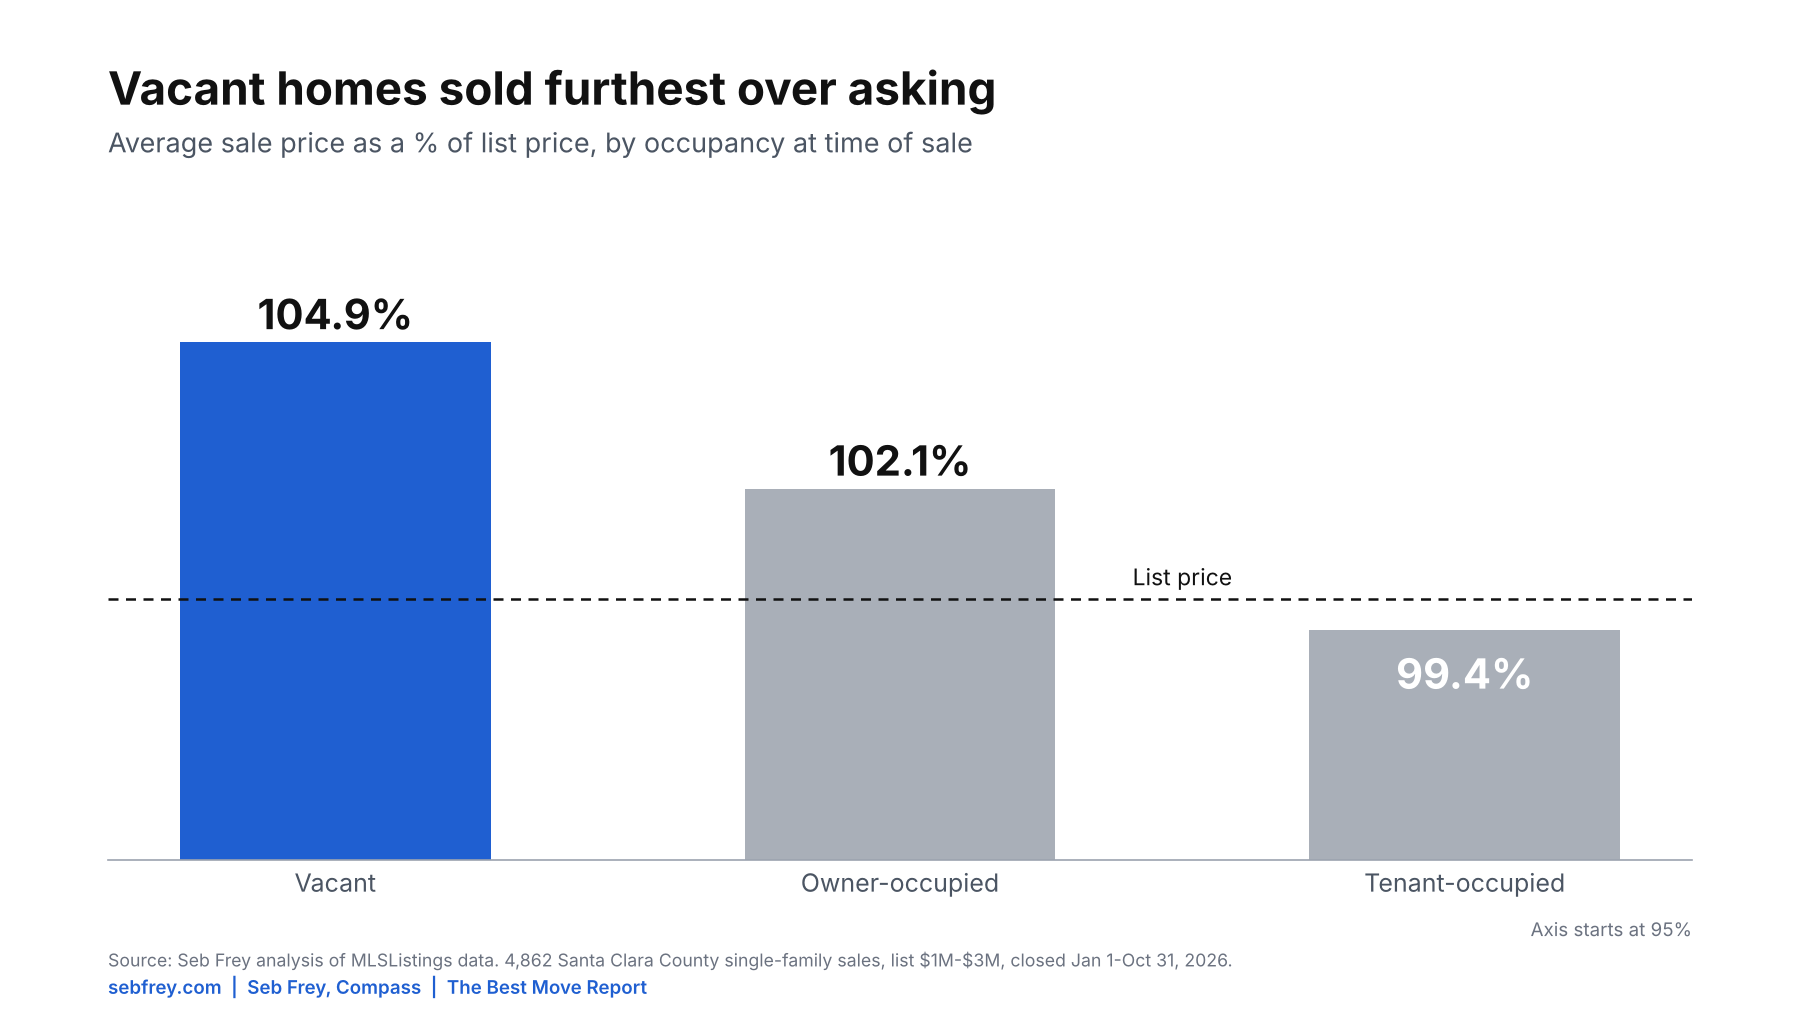
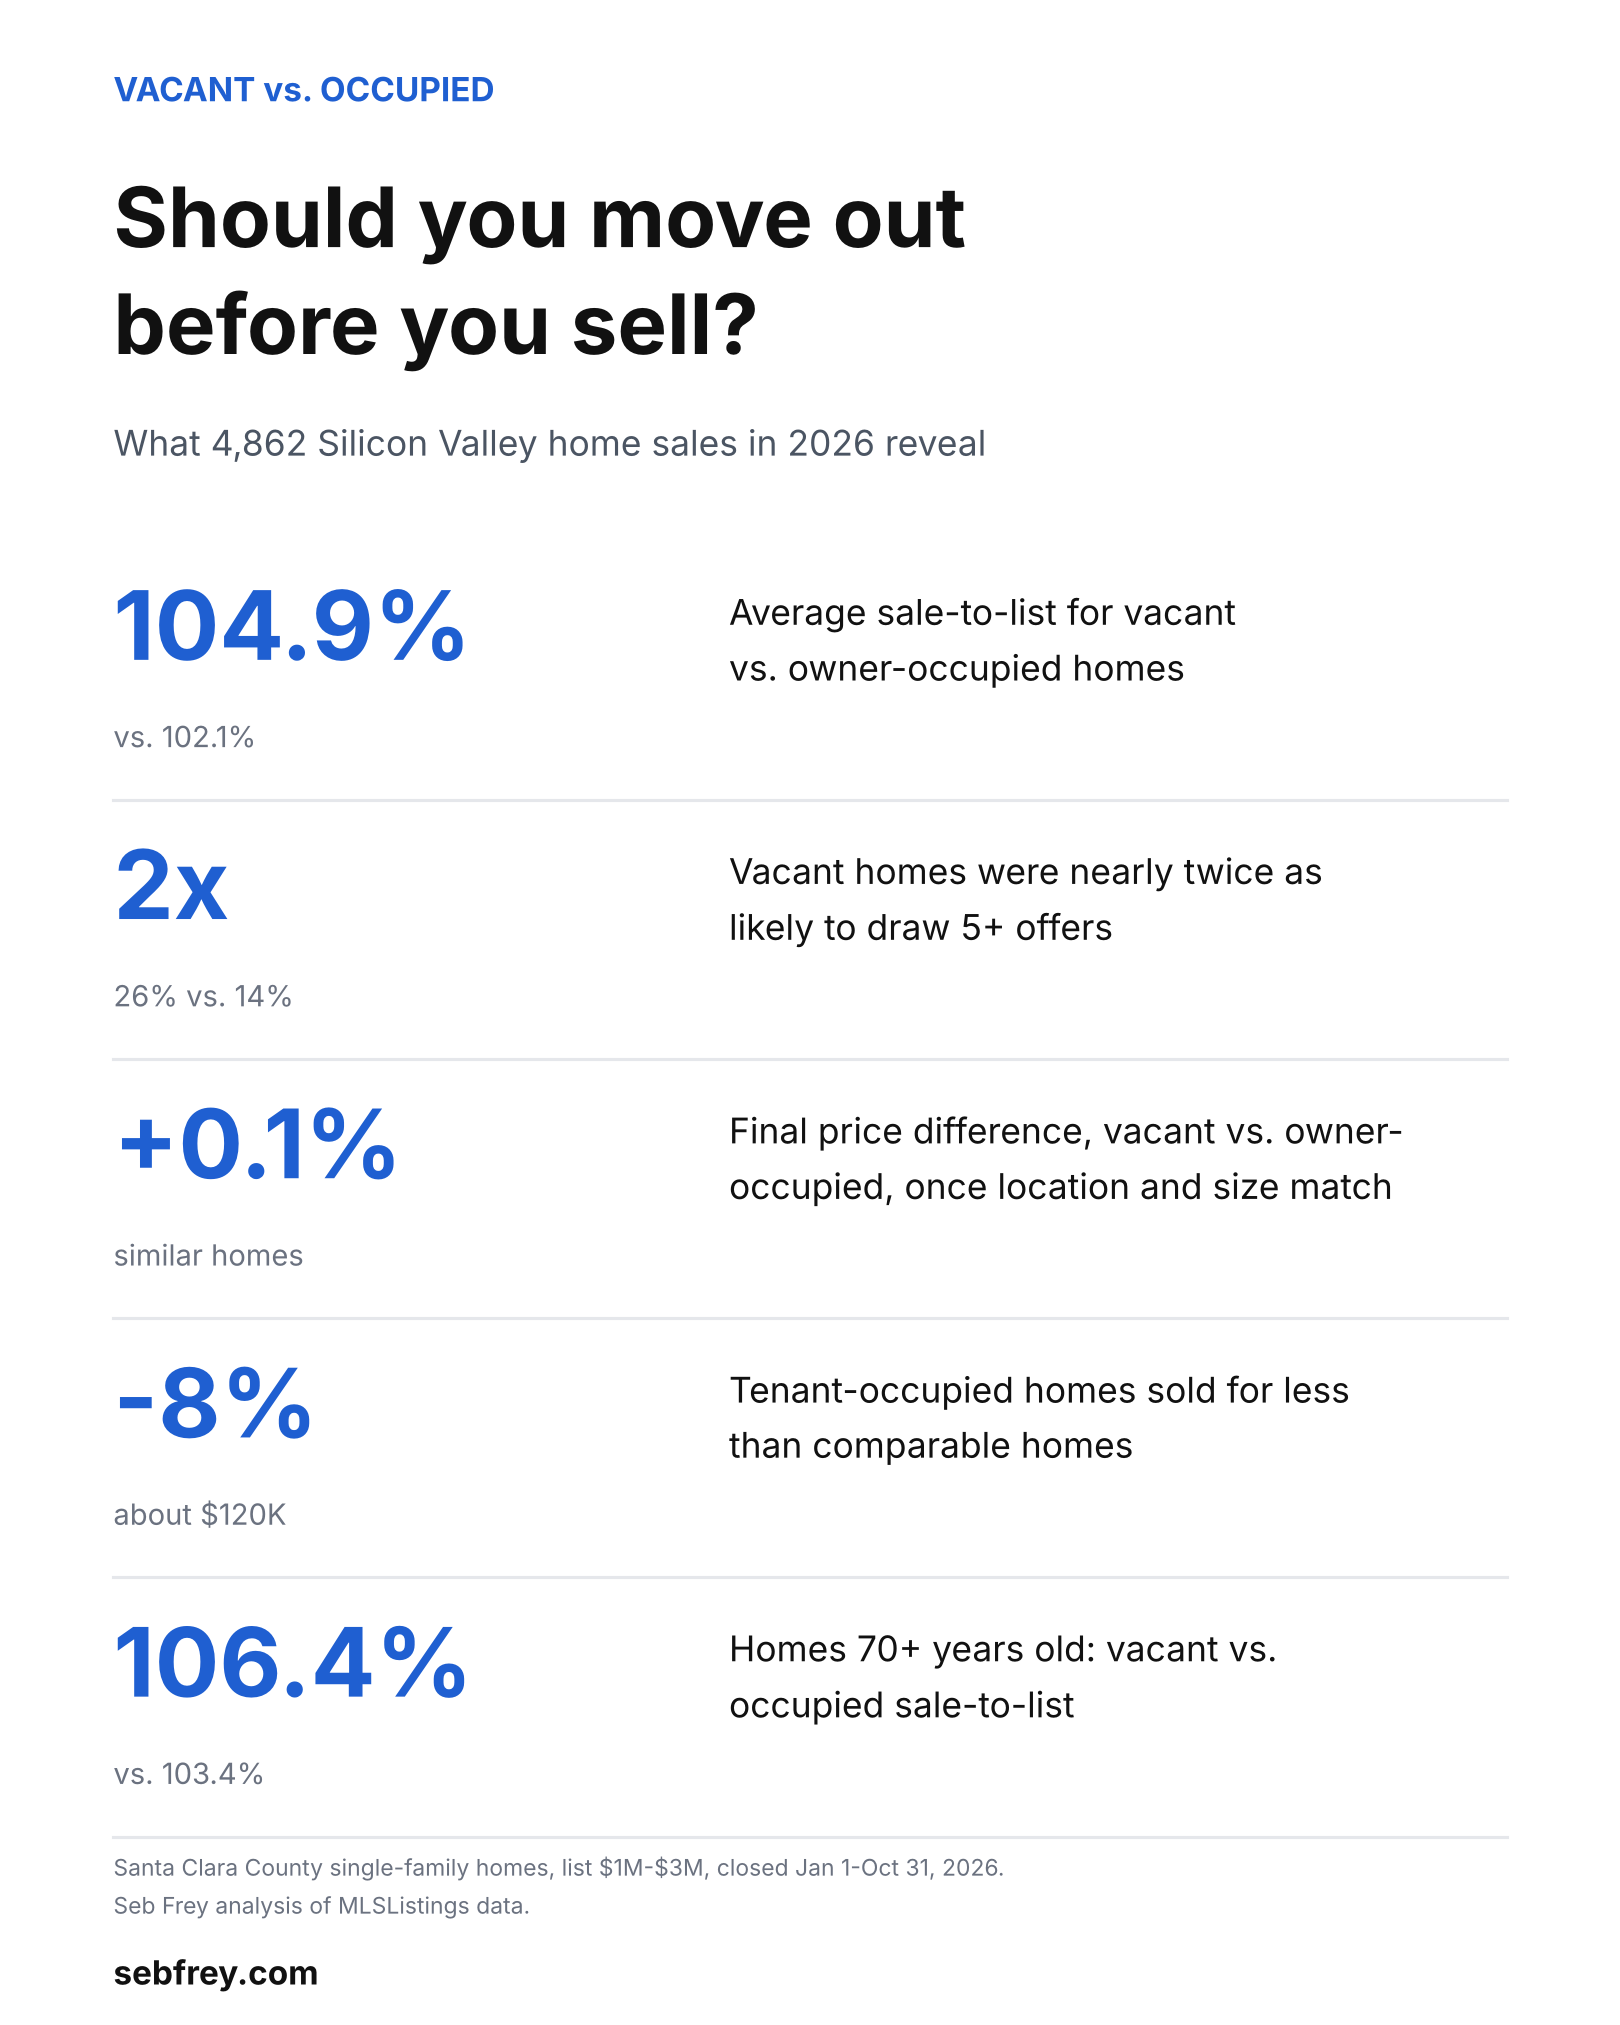
Vacant homes closed at an average of 104.9% of their list price. Owner-occupied homes closed at 102.1%, and tenant-occupied homes actually sold below list on average, at 99.4%. On a $1.8 million listing, the gap between vacant and owner-occupied works out to roughly $50,000 more over asking.
Vacant Homes Created Bigger Bidding Wars
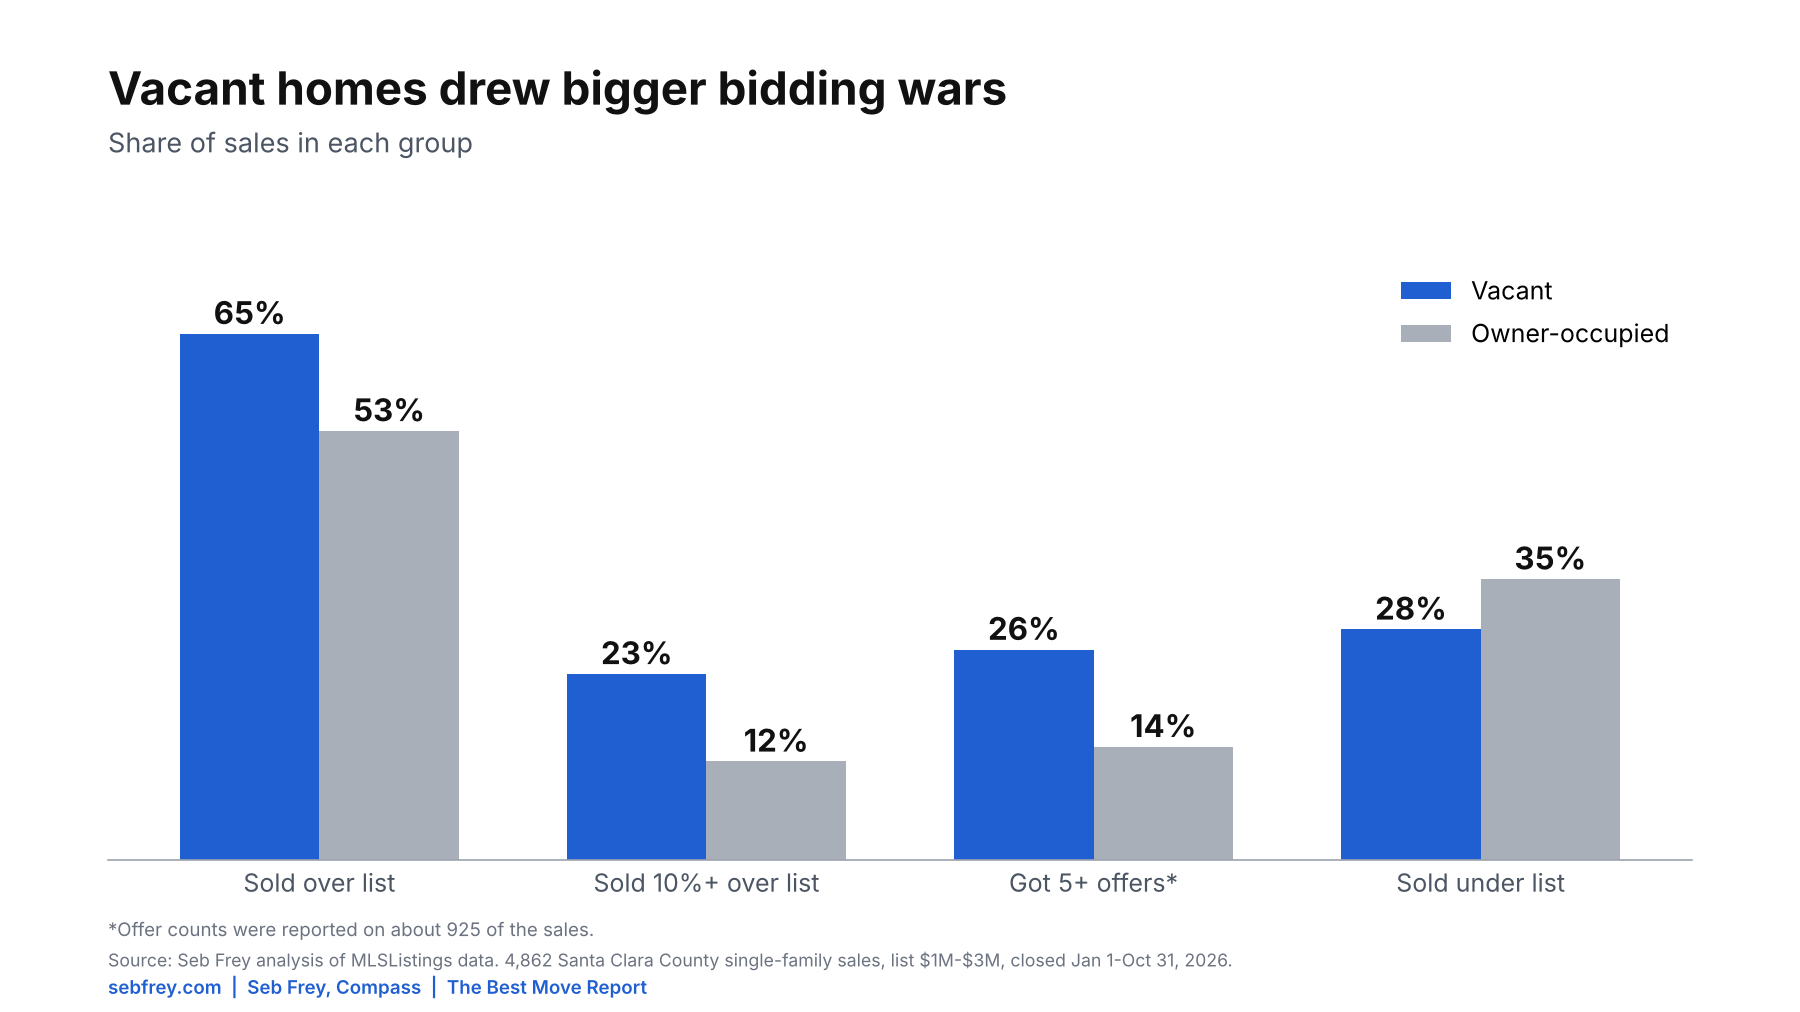
The over-list gap comes from competition. Of the vacant homes where the listing reported an offer count, 26% received five or more offers, compared with 14% of owner-occupied homes. Vacant homes averaged 4.0 offers vs. 2.8 for owner-occupied homes. They were also almost twice as likely to sell 10% or more over list (23% vs. 12%), and less likely to sell under list (28.5% vs. 34.7%).
Vacant Homes Were Less Likely to Get Stuck
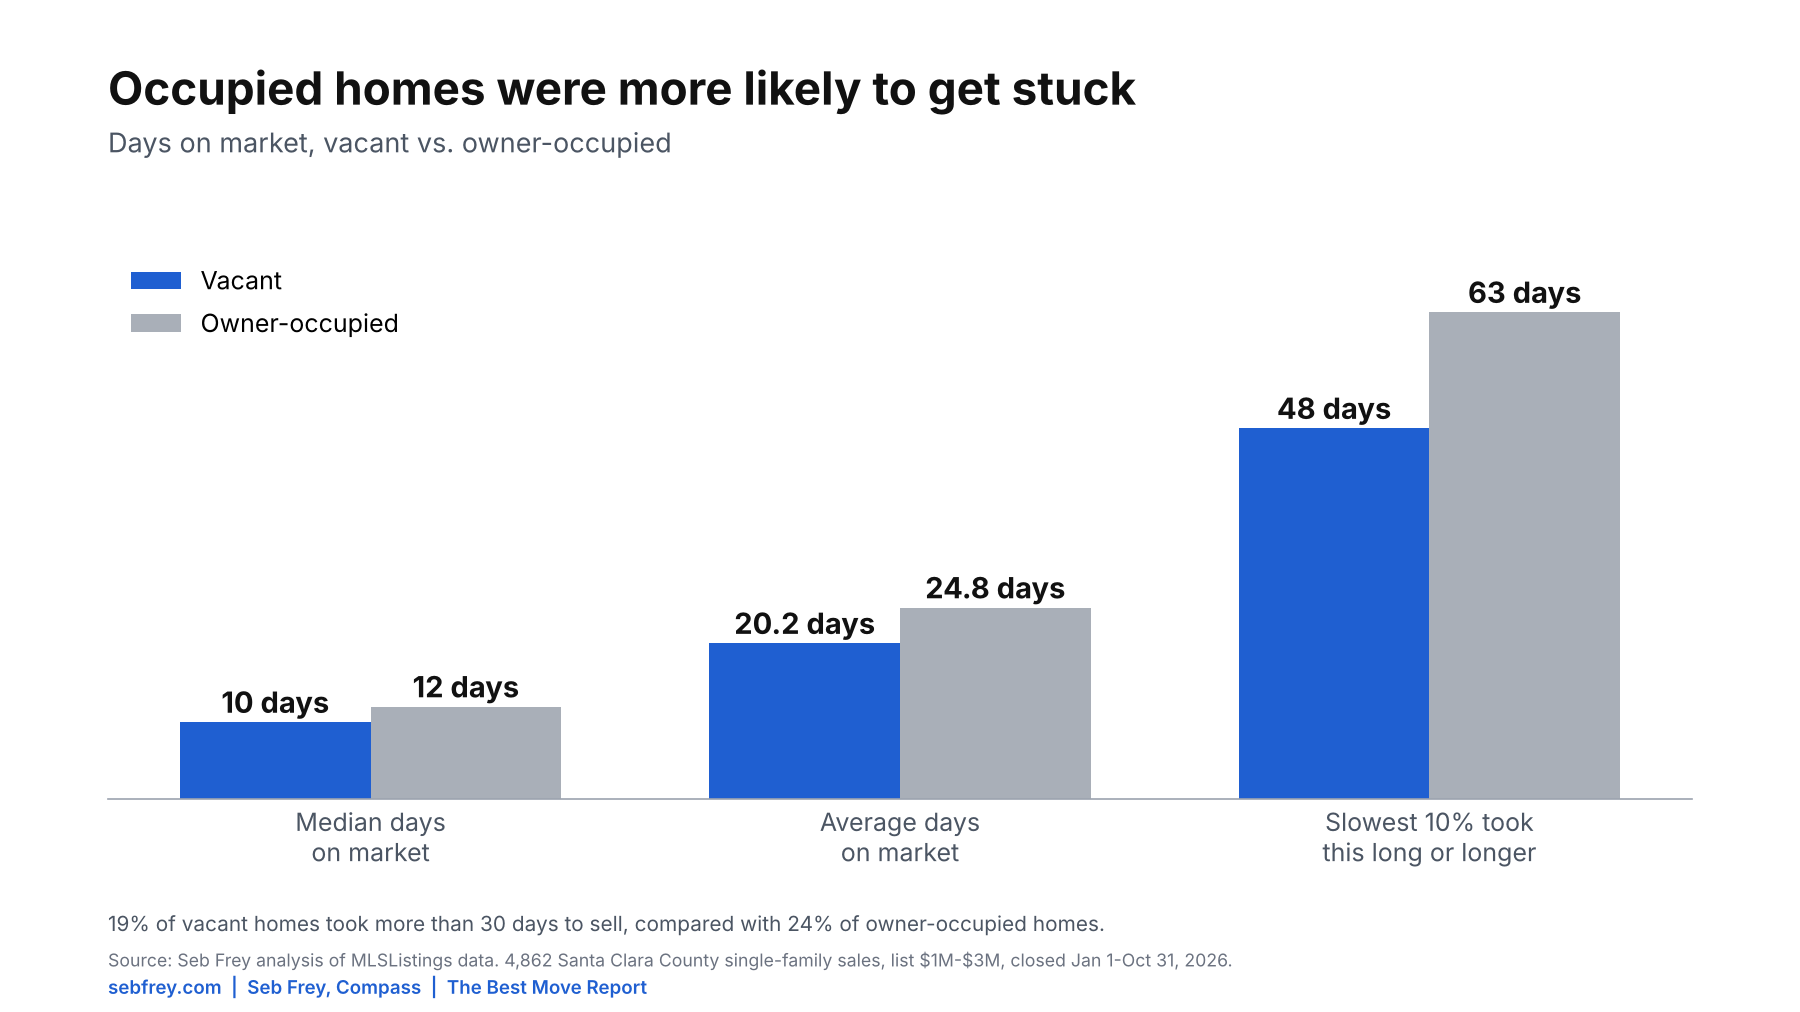
The typical home sold fast either way. Median days on market was 10 for vacant homes and 12 for owner-occupied ones, which isn’t a meaningful difference once you account for location and size. The real difference shows up in the slow tail. 24% of owner-occupied homes sat more than 30 days compared with 19% of vacant homes, and the slowest 10% of owner-occupied homes took 63 days or more, compared with 48 for vacant homes.
The Surprise: The Final Price Was About the Same
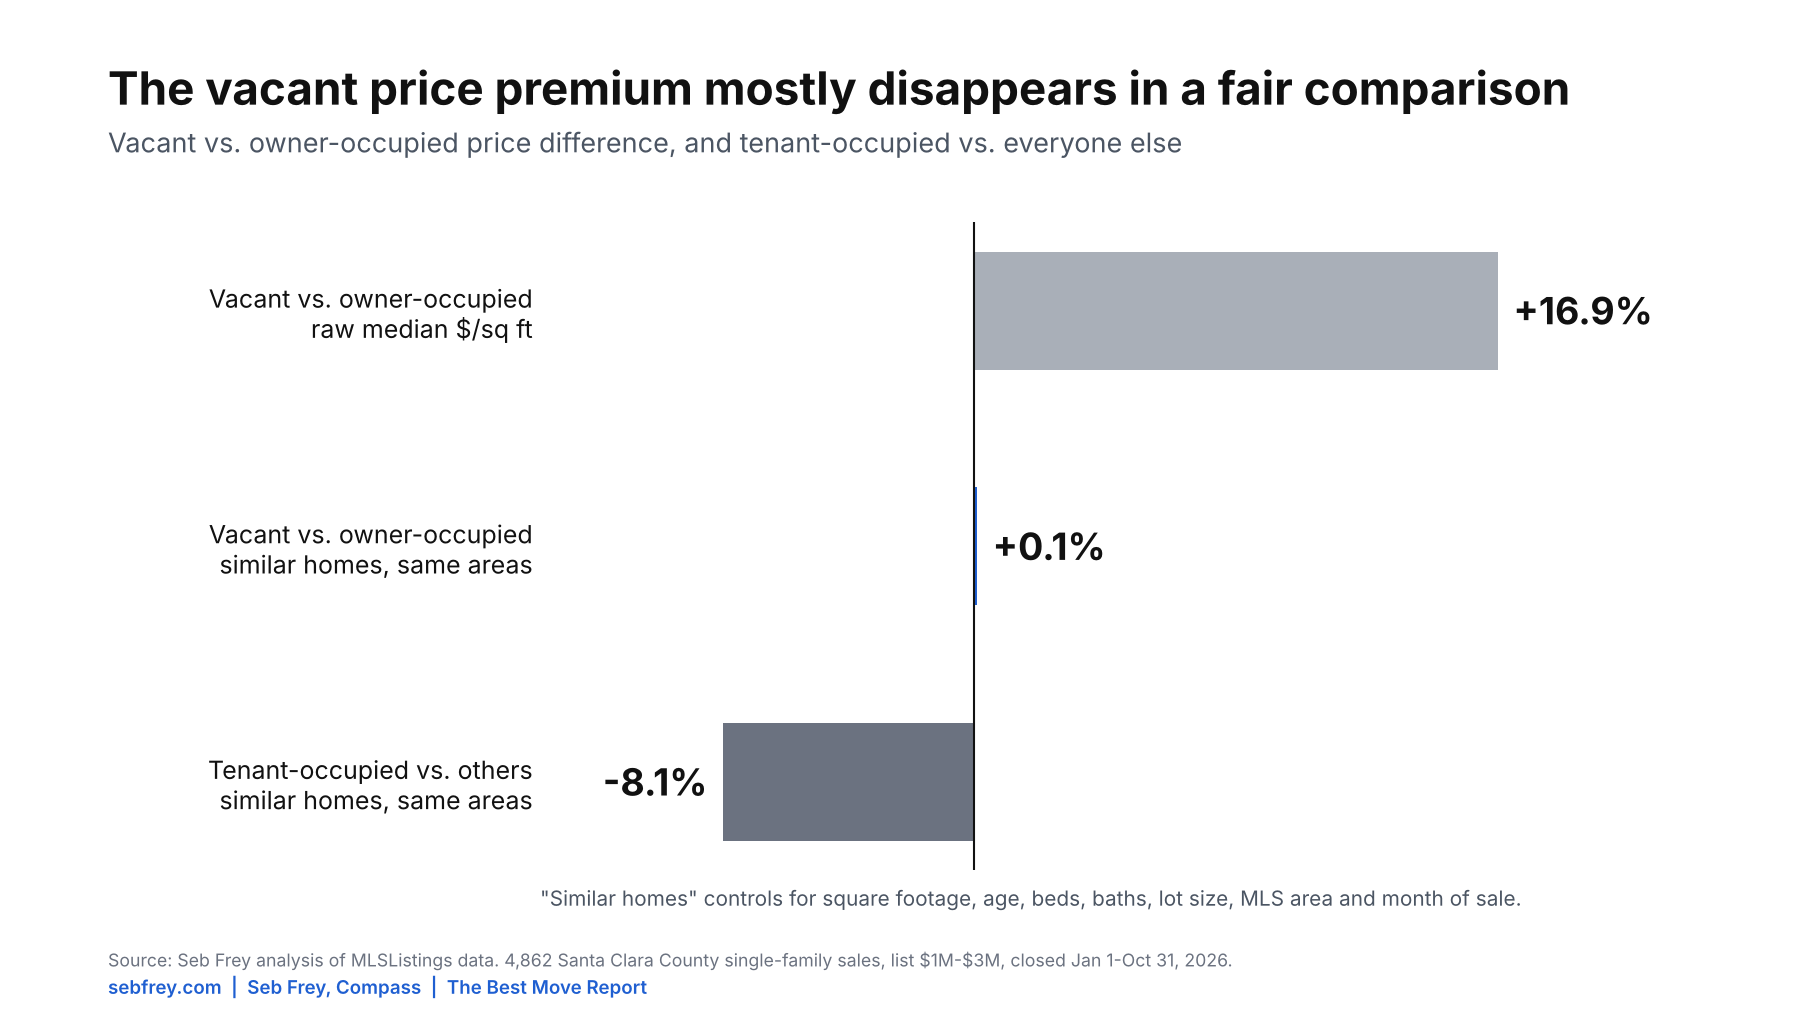
Here’s where the headline numbers can fool you. On the surface, vacant homes sold for 16.9% more per square foot ($1,111 vs. $950). But vacant homes in this data set were smaller (1,676 vs. 1,843 square feet) and concentrated in the most expensive cities. 78% of Palo Alto and Sunnyvale sales were vacant, compared with 34% in Gilroy and 36% in Morgan Hill.
So I ran a regression that compares like with like, controlling for square footage, age, bedrooms, bathrooms, lot size, MLS area and month of sale. Once you do that, vacant homes sold for essentially the same price as owner-occupied homes (+0.1%). They were listed about 0.5% lower than comparable occupied homes, then bid up to the same place. The extra competition gets the seller to market value with more certainty. It doesn’t get them a premium on top of it. That lines up with a 2015 study in the Journal of Housing Research, which found that staging made buyers like a home more but didn’t raise what they paid for it.
The Tenant Discount Is Real, and It’s Big
Tenant-occupied homes were the clear losers. Compared with similar homes in the same areas, they sold for about 8% less than both vacant and owner-occupied homes. That’s roughly $120,000 on a $1.5 million house. They were also the only group to sell below list on average, and 45% of them sold under asking.
Only 83 sales in the study were tenant-occupied, and rentals often show more wear than owner-occupied homes, so part of that gap is likely condition. Even so, it’s the largest effect in the data, and it lines up with what buyers deal with in practice: limited showing windows, tenant rights to work around, and a house they can’t really picture as their own.
Older Homes Gained the Most From Being Vacant
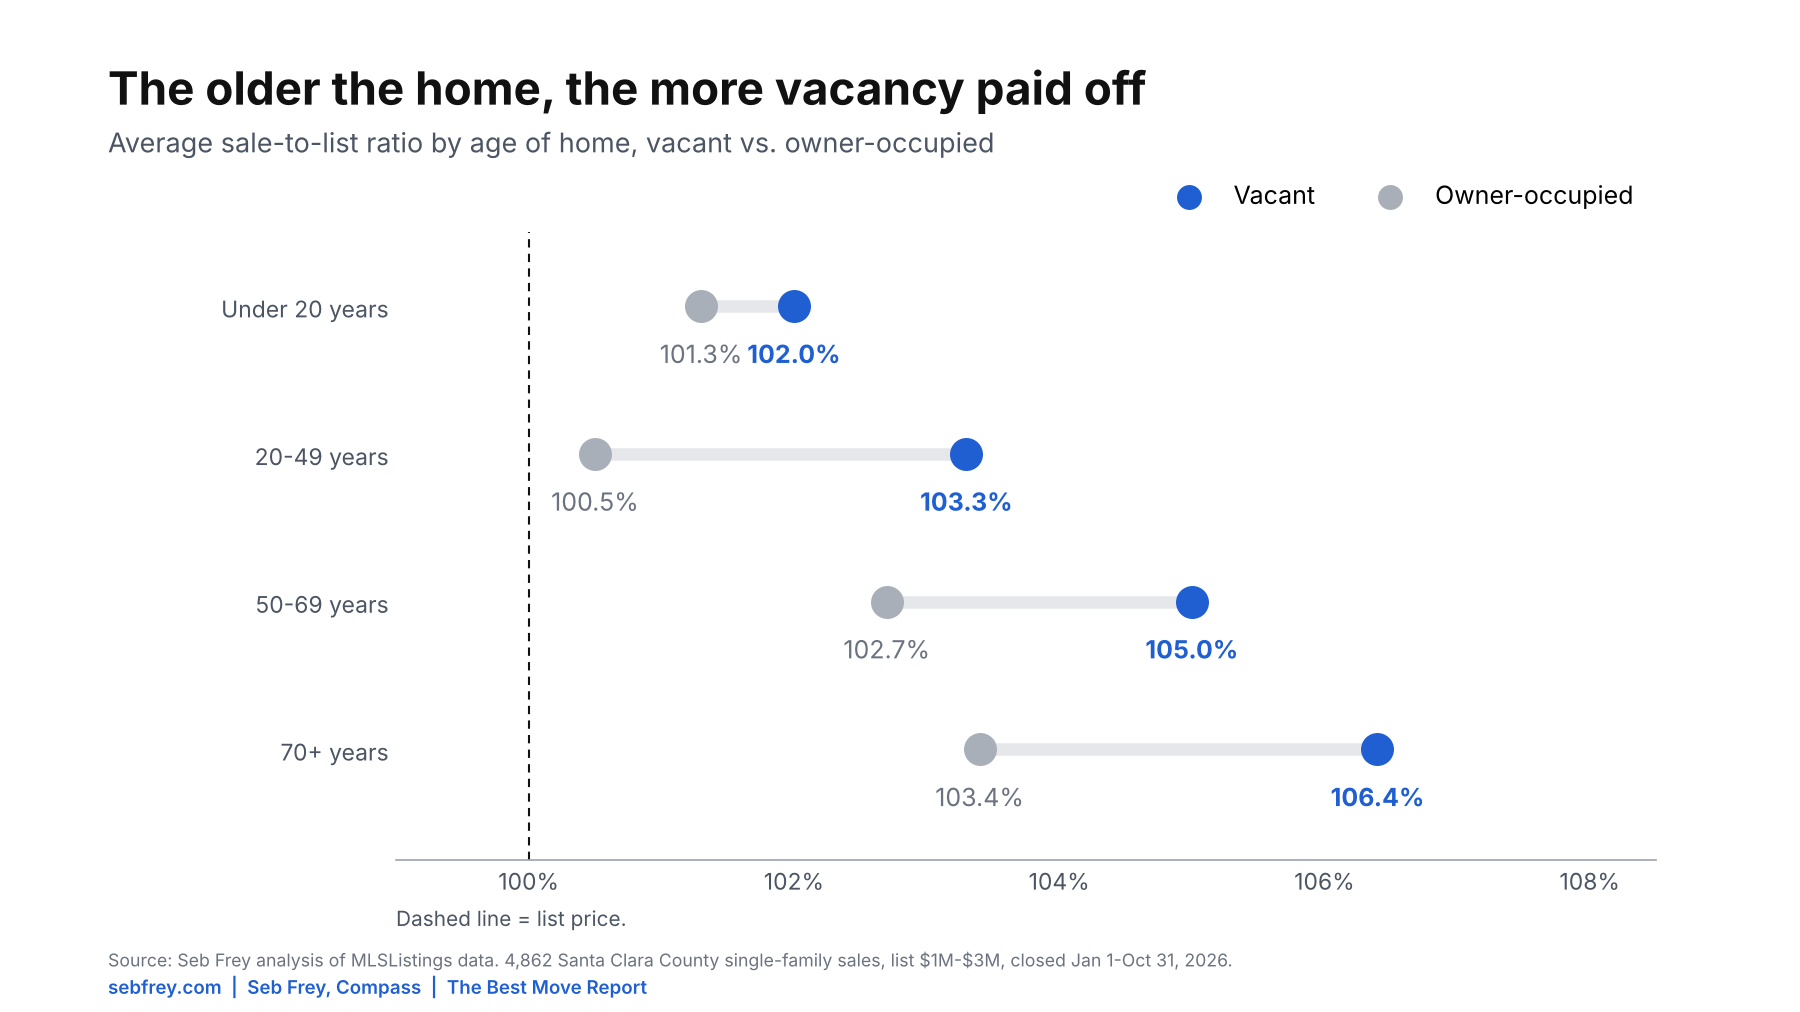
This is the finding that matters most for longtime owners. For homes under 20 years old, being vacant barely moved the needle (102.0% of list vs. 101.3%). For homes 70 years and older, vacant homes sold at 106.4% of list compared with 103.4% for owner-occupied ones. A dated house full of decades of belongings is the hardest one for a buyer to see past, and that’s exactly where an empty, staged house competes best.
The Vacant Edge Grows With Price
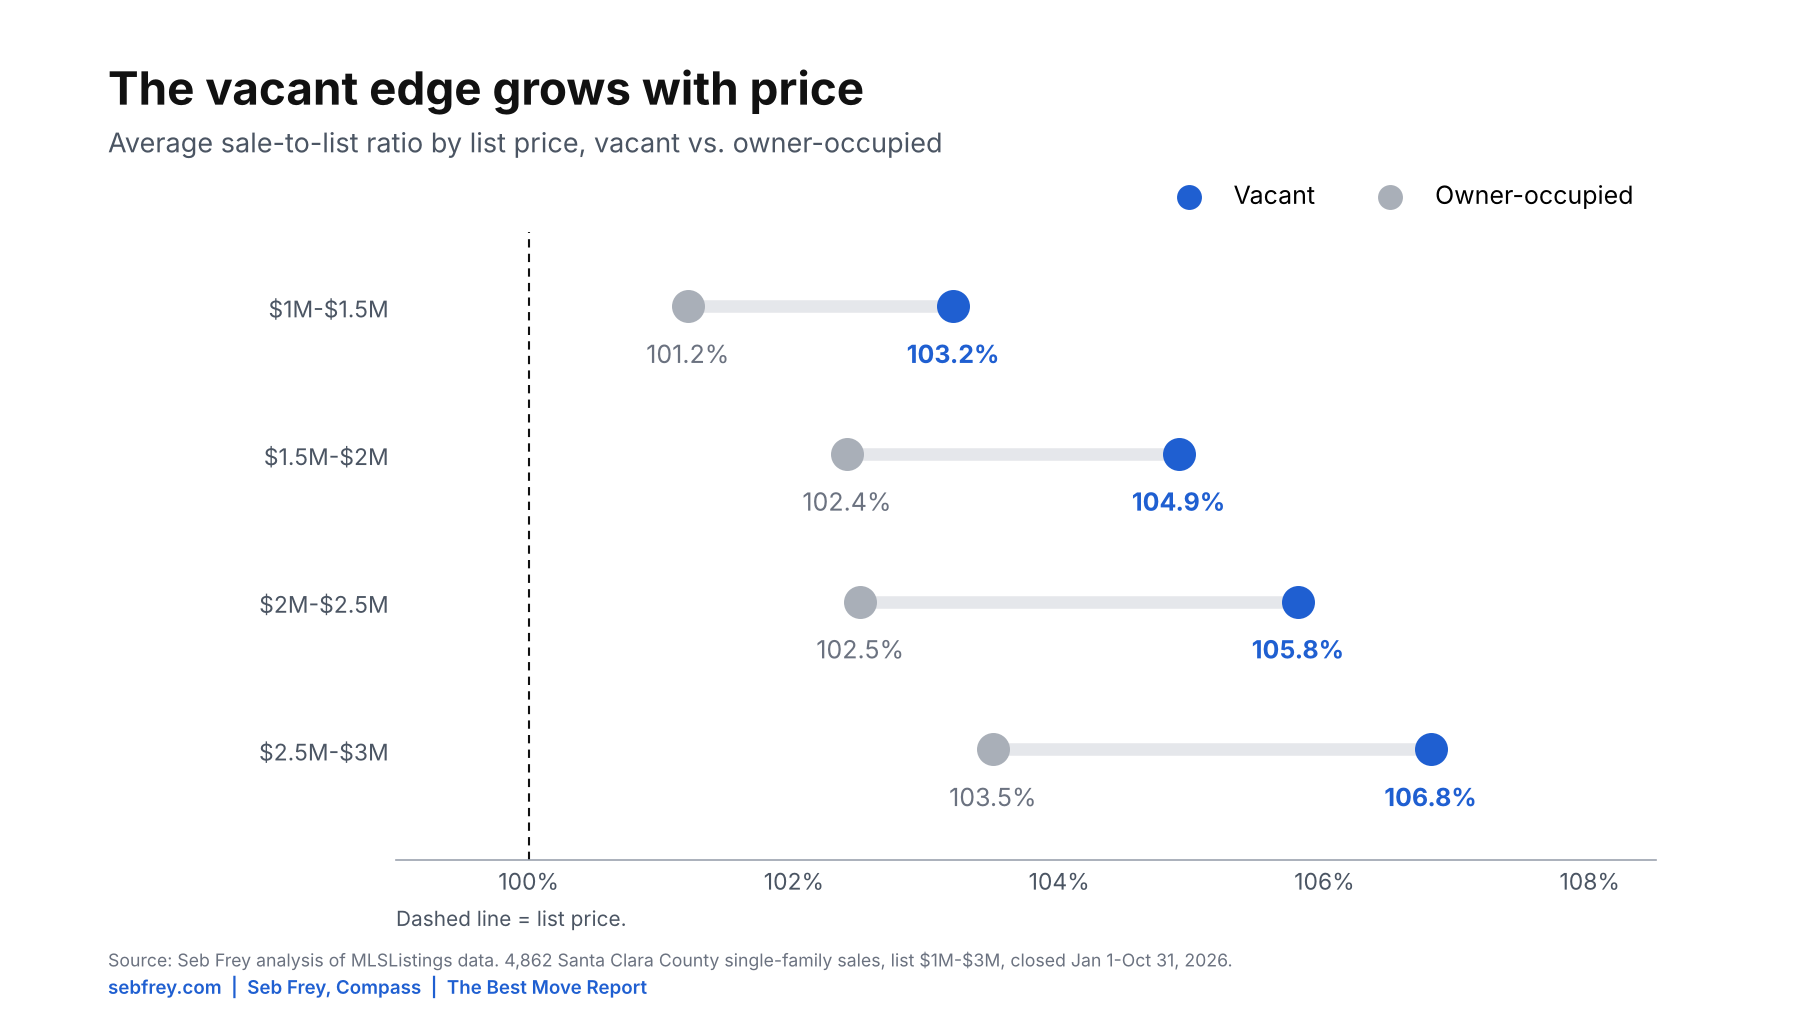
In every price band, vacant homes sold further over list, and the gap widened as prices rose. Under $1.5 million it was 103.2% vs. 101.2%. In the $2.5 million to $3 million band it was 106.8% vs. 103.5%. The $2 million to $2.5 million band showed the biggest difference in getting stuck: 24% of owner-occupied homes there took more than 30 days, compared with 13% of vacant homes.
Where It Mattered Most: Palo Alto, Mountain View and Sunnyvale
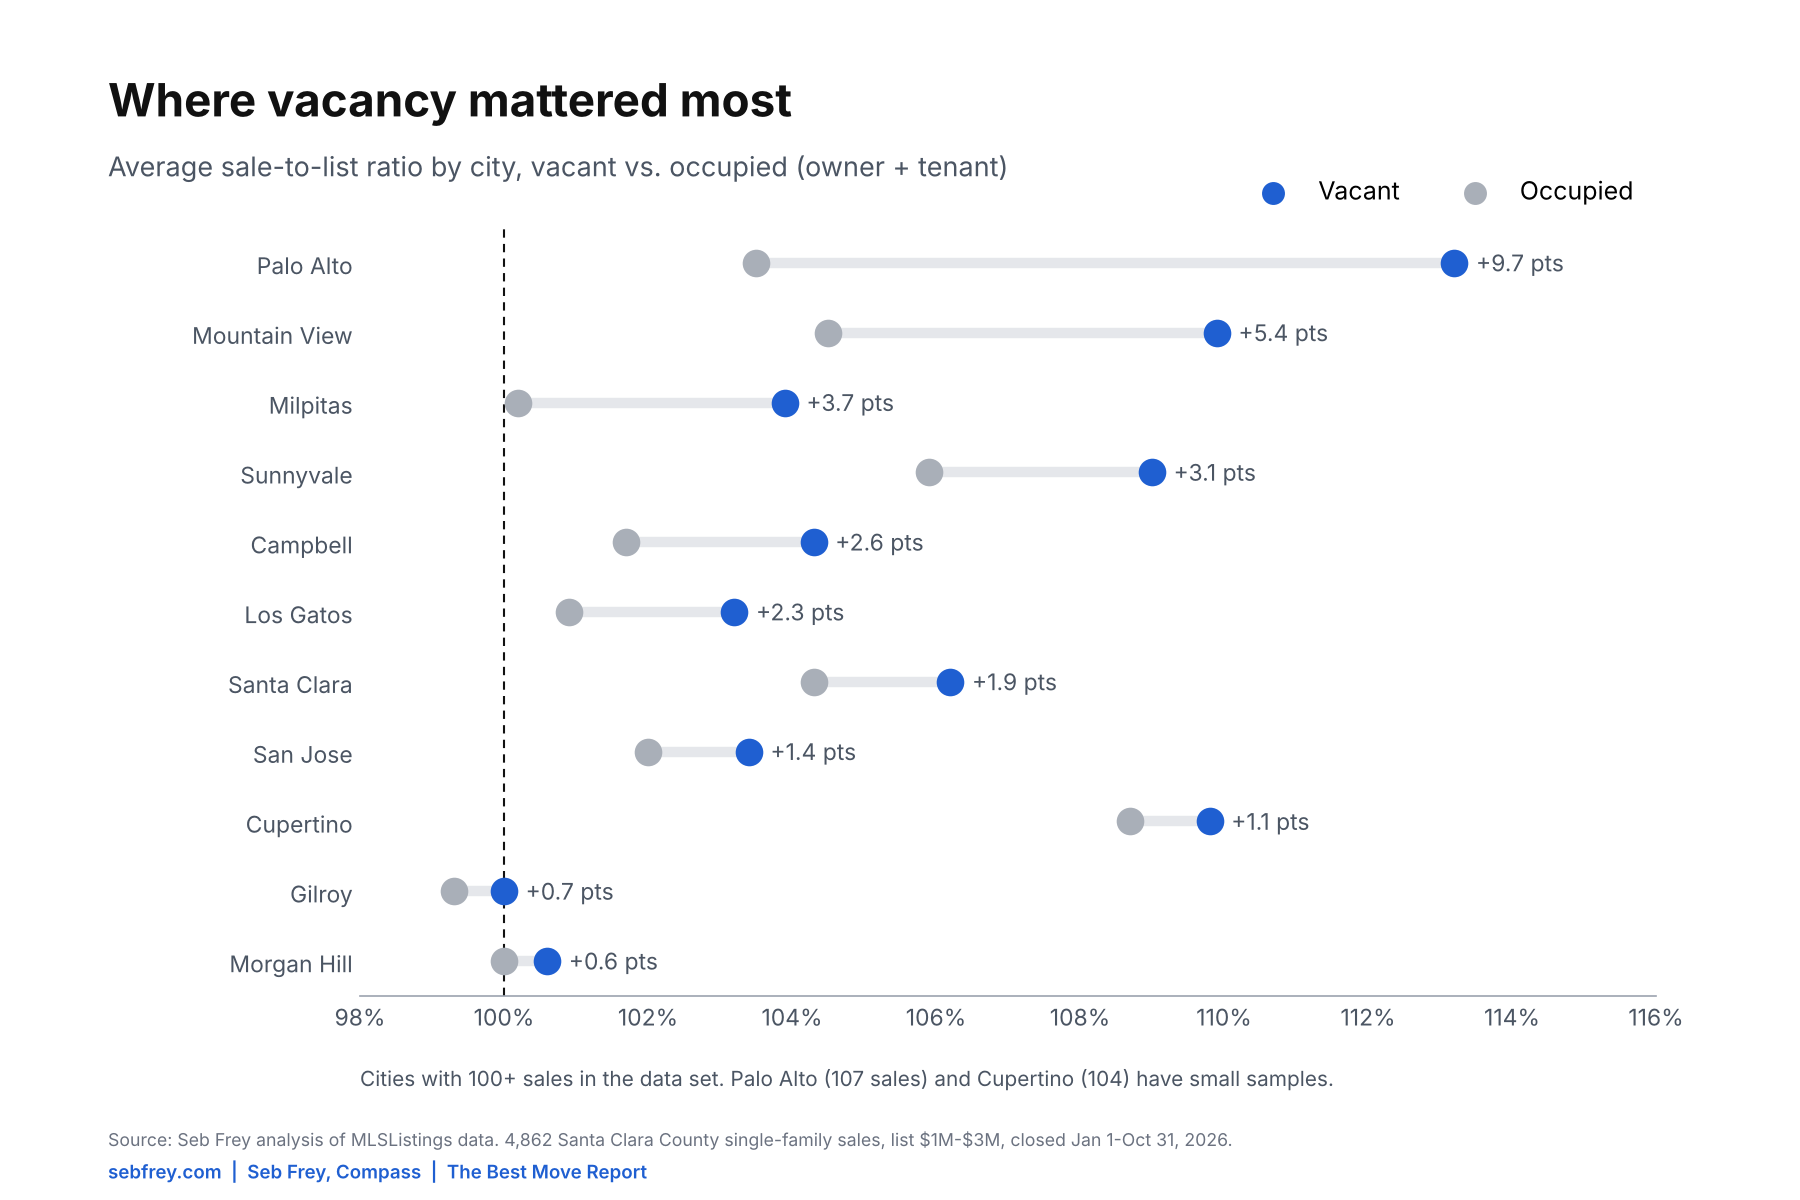
The hottest markets showed the biggest gaps. In Mountain View, vacant homes sold at 109.9% of list in a median of 8 days, while occupied homes sold at 104.5% in 14 days. Palo Alto (113.2% vs. 103.5%) and Sunnyvale (109.0% vs. 105.9%) followed the same pattern, though Palo Alto’s sample was small at 107 sales. In South County it barely mattered, with Gilroy and Morgan Hill both showing gaps under one point.
Selling Vacant Is Becoming the Norm
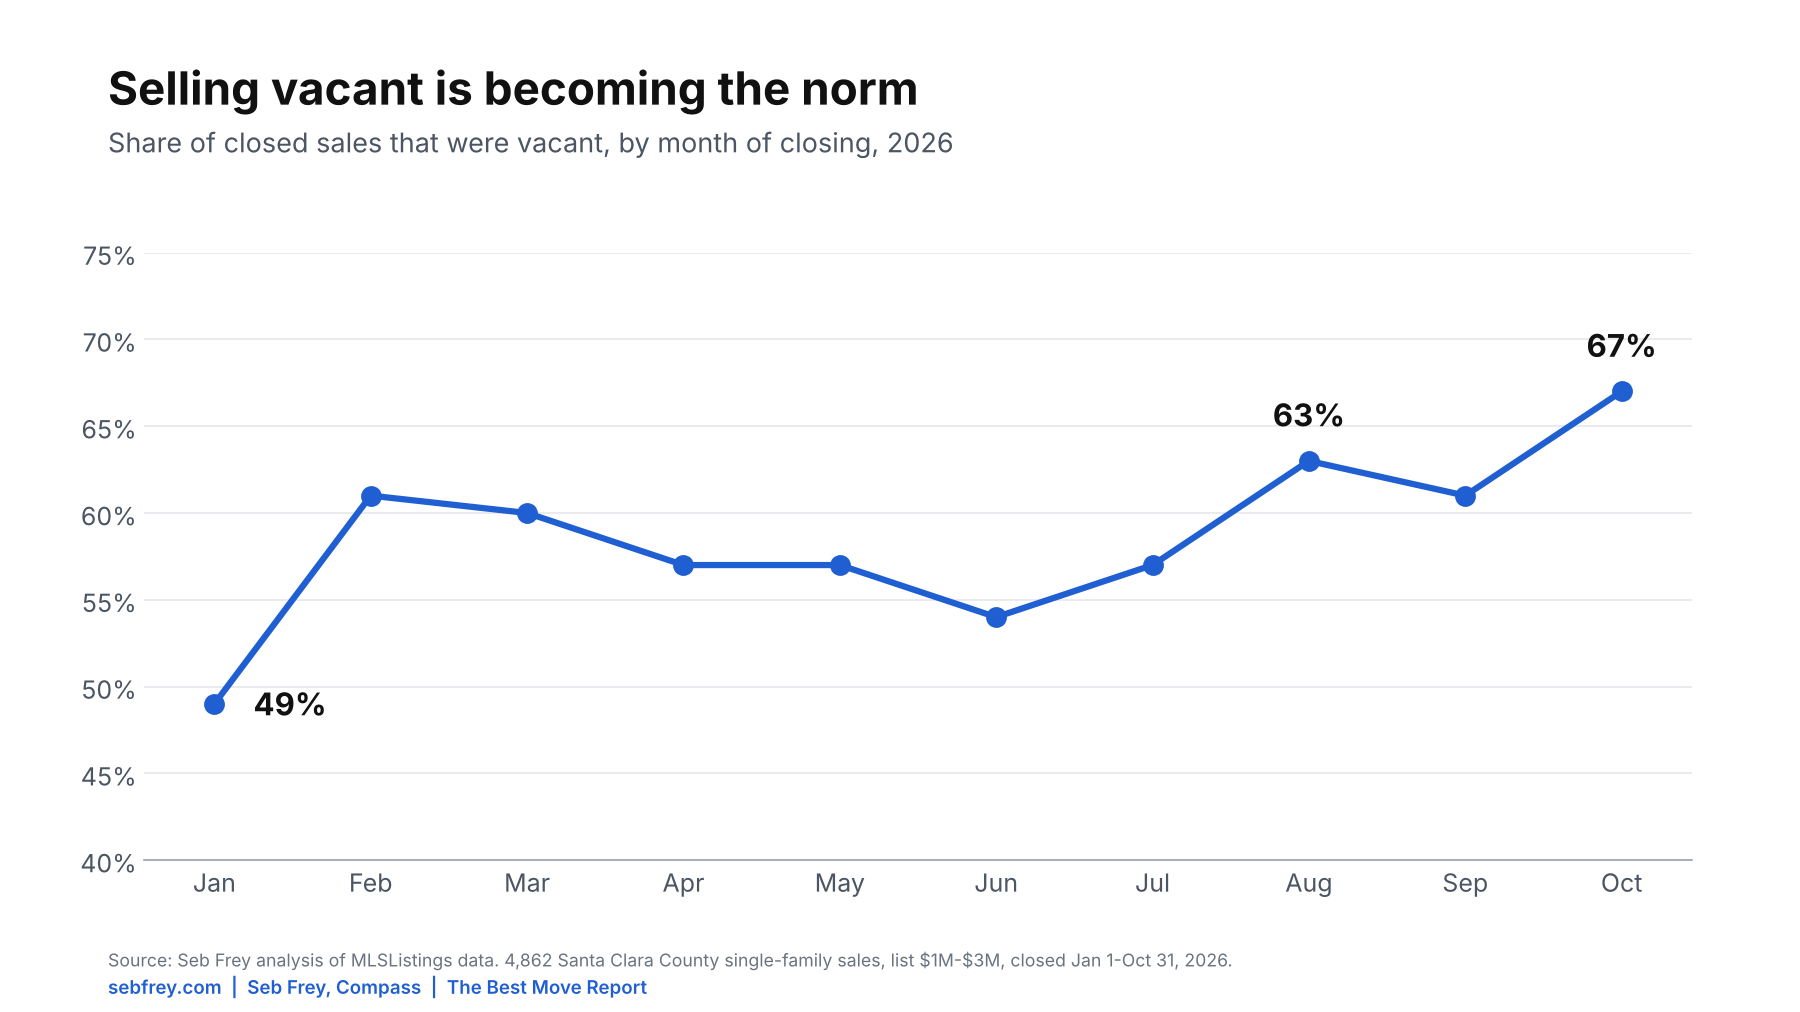
59% of the homes in this study sold vacant. The share climbed through the year, from 49% of January closings to 67% of October closings. When two out of three homes on the market are empty and staged, an occupied home is competing against a polished standard that buyers now expect.
What This Means If You’re Selling
If you take one thing from this study, make it this: moving out before you list is about controlling risk, not chasing a windfall. Vacant homes in Silicon Valley drew more buyers, more offers and fewer stale listings, but comparable homes ended up in about the same place on price. That changes the math on whether moving out first is worth the cost and disruption for your family.
When Moving Out First Makes the Most Sense
- Your home is 50+ years old, dated, or full of decades of furniture and keepsakes. That’s where the vacant advantage was largest in the data.
- You’re in a high-competition city like Mountain View, Sunnyvale, Palo Alto or Santa Clara, where buyers expect a staged, move-in-ready presentation.
- You’re priced above $2 million, where occupied homes were nearly twice as likely to sit more than 30 days.
- You’re already planning a move to a smaller home, a 55+ community or closer to family, and the timing can work.
When Staying Put Can Work
- Your home is newer and already shows well. Under 20 years old, the gap was less than a point.
- You’re in South County, where the vacant edge almost disappeared.
- Moving twice would be harder on you or a family member than a slightly longer sale.
If you stay, act like you’re vacant. Pull out at least a third of the furniture, clear every surface, put personal items in storage, and make showings easy. The data says the risk of an occupied sale is the long tail, so price it right from day one rather than testing the market high.
Simple Strategy Guide
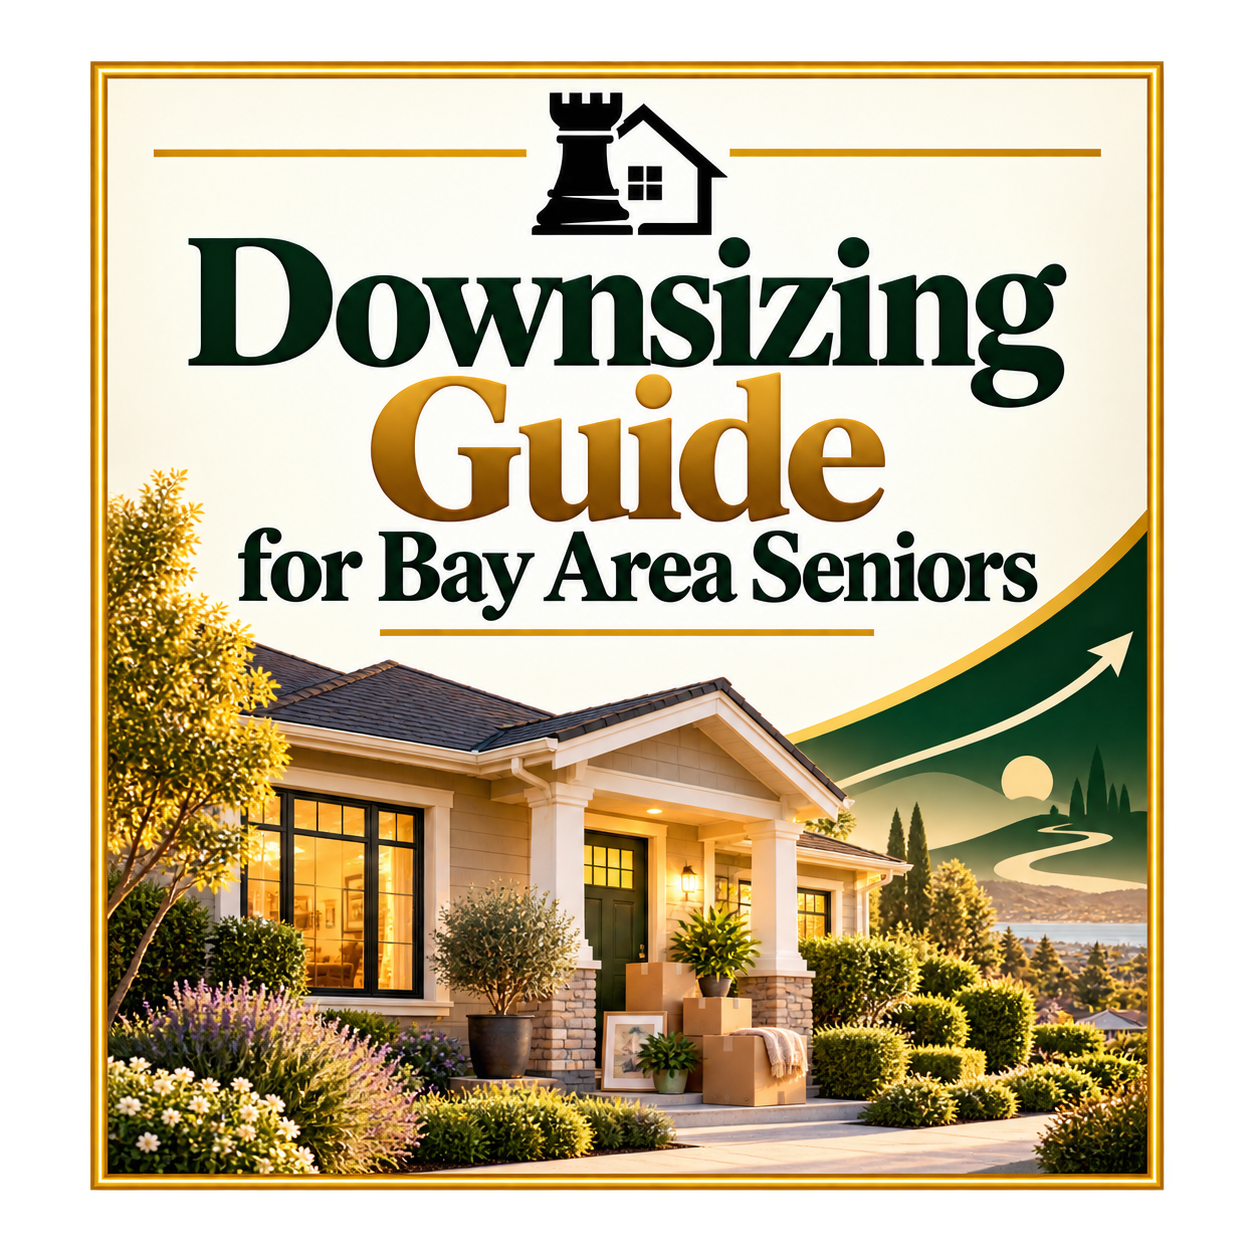
The Downsizing Guide for Bay Area Seniors
What to keep, what to let go, and how to get your home ready for today's buyers without a costly remodel, so you protect your equity and move on your own timeline.
You're all set. Thanks! The Downsizing Guide is on its way to your inbox. If you don't see it in a few minutes, check your promotions or spam folder.
If You Have a Tenant, Plan Early
Tenant-occupied homes took the biggest hit in this study. Before you list, talk with your agent and a real estate attorney about the lease timeline, tenant protections in your city (cities like San Jose and Mountain View have their own rules on top of state law), and whether a negotiated move-out makes sense. Selling vacant, even if it means waiting a few months, may be worth far more than the rent you’d lose.
For older homeowners, the hard part usually isn’t the house. It’s figuring out where to go first, how to fund the move before the sale closes, and what to do with a lifetime of belongings. That’s exactly what my Best Move Method is built around: we sort out the strategy and the sequence before anything goes on the market. If you’re weighing whether to move out first, book a free 30-minute Best Move Strategy Session and we’ll walk through your numbers together.
How This Study Was Done
The data set is every single-family home sale in Santa Clara County recorded in MLSListings with a list price between $1 million and $3 million and a close date between January 1 and October 31, 2026. That’s 4,874 sales. 4,862 had an occupancy status entered by the listing agent: vacant (2,855), owner-occupied (1,022), “call agent” (854), tenant-occupied (83) and manager (48). The main comparisons use vacant, owner-occupied and tenant-occupied homes. Two records with obviously bad square footage or price data were excluded.
Sale-to-list ratio is the final sale price divided by the final list price. Days on market is MLS days on market, which resets when a home is relisted. Offer counts are only reported on about a quarter of sales, so those figures come from roughly 925 listings. The like-for-like price comparison is an ordinary least squares regression on log sale price, controlling for square footage, age, bedrooms, bathrooms, lot size, MLS area and month of close. The vacant vs. occupied sale-to-list difference (+1.6 points) and the over-list difference (+8 points) are statistically significant. The price difference between vacant and owner-occupied homes is not.
There are limits to what this data can show. Occupancy is self-reported by listing agents at the time of listing, and the MLS has no reliable field for condition or whether a home was staged.
Free 3-minute decision check
Stay, downsize, or move away? Find out which one costs you the least.
For longtime Bay Area owners, the wrong call can cost six figures in taxes, remodeling, or years of higher living costs. Answer a dozen quick questions and see all three paths side by side, with a rough dollar figure for what each one would cost you or free up.
See My Best Path →Rather talk now? Call or text 408.413.3087
How to Cite This Study
Reporters and bloggers are welcome to use these findings and charts with a link back to this page. Suggested citation: Seb Frey, “Vacant vs. Occupied Home Sales Study,” sebfrey.com, November 2026, based on MLSListings data. Based on information from MLSListings, Inc., deemed reliable but not guaranteed. The summary graphic below is free to share as well.
Frequently Asked Questions
Should a house be vacant when you sell it?
In most cases it helps. In 2026 Santa Clara County sales, vacant homes sold at 104.9% of list vs. 102.1% for owner-occupied homes, drew more offers, and were less likely to sit past 30 days. Comparable homes ended up at about the same final price, though, so moving out mainly buys speed and certainty. If the home is tenant-occupied, selling vacant matters much more, since tenant-occupied homes sold for about 8% less.
Do vacant homes sell for more than occupied homes?
Vacant homes sold further over asking (104.9% vs. 102.1% of list), but comparable vacant and owner-occupied homes in the same areas ended up at about the same final price. Vacant homes tend to be listed slightly lower and bid up.
Do vacant homes sell faster?
The median difference was small (10 vs. 12 days), but vacant homes were less likely to linger. 19% took more than 30 days, compared with 24% of owner-occupied homes.
How much does a tenant cost a seller?
In this study, tenant-occupied homes sold for about 8% less than comparable homes, and 45% sold below list price.
Should older homeowners move out before selling?
The data suggests it helps most with older homes. Homes 70+ years old sold at 106.4% of list when vacant vs. 103.4% when occupied. Whether it’s worth it depends on your timing, finances and where you’re moving next.
What percentage of homes sell vacant in Silicon Valley?
59% of the $1 million to $3 million single-family sales in Santa Clara County in 2026 were vacant, rising to 67% in October.
Free Seller Strategy Session
Before we talk money, let's talk about you.
The biggest financial wins in a move happen long before a home hits the market, and they start with understanding your situation. In 30 minutes we'll talk through what's changing, who's involved, and what you need this move to do for you, then map out a plan that gets you there with a clear financial advantage.
Book My Strategy Session →
Senior Friendly Homes in Silicon Valley South
2
3
4
5
6
7
8
9
10
11
12
13
14
15
16
17
18
19
20
21
22
23
24
25