
November 2020 Report with a Focus on North Santa Cruz County Cities
The November 2020 Santa Cruz County Real Estate Report will show that the Santa Cruz County real estate market is perhaps the strongest anyone can ever recall seeing. This article provides a number of charts and graphs that show in stark relief the state of the market.
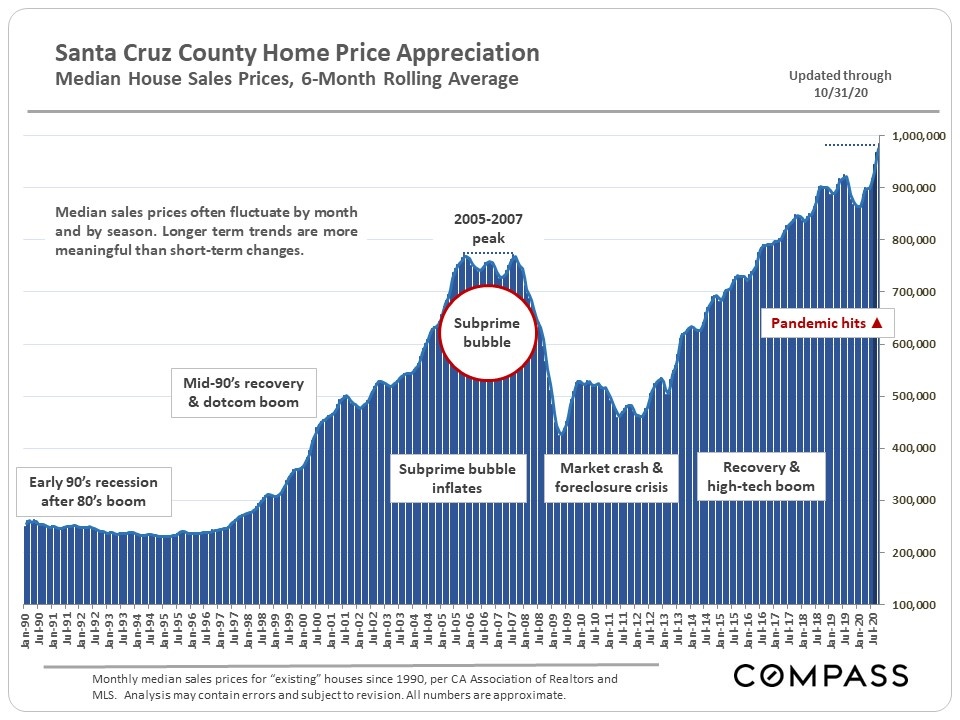
The long-term median sales price chart below is similar to those for counties around the Bay Area – a significant spike in median house prices since the pandemic struck in early spring.
As I’ve said elsewhere, recent jumps in median prices have been driven not only by appreciation in fair market values, but by increases in expensive home sales. Yes, the median price is up significantly, but the square footage of homes and the lot size are up markedly from years past. Affluent buyers have made up a significantly larger percentage of Santa Cruz home purchases since the pandemic hit.
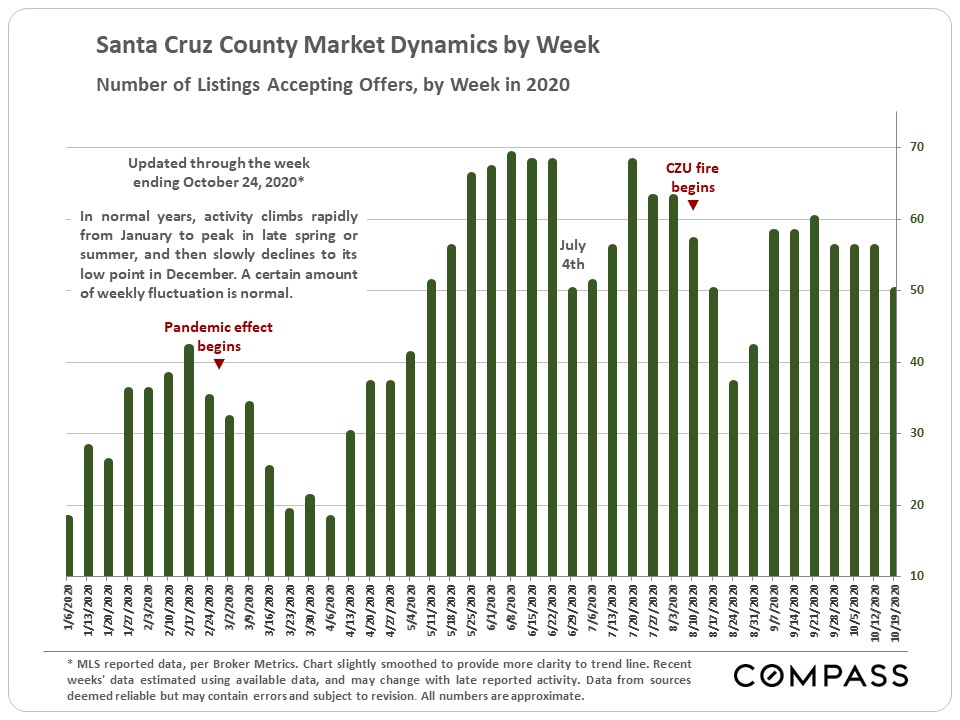
The chart above illustrates market response and rebound from the 2 major disasters of the year.
The market typically starts a big slowdown in mid-November, running through the mid-winter holidays, until it springs back to life in about the middle of January.
This year, the pandemic upended seasonality: Spring, usually the strongest selling season, saw a crash in activity. A dramatic recovery ensued, interrupted by the CZU fire, before bouncing back again. On a year-over-year, month-by-month basis, sales activity in May-October 2020 was above each of the corresponding months of 2019 – even this past August (by a tad).
I suspect late Q4 will still see something of a seasonal slowdown, but remain considerably more active than in recent years.
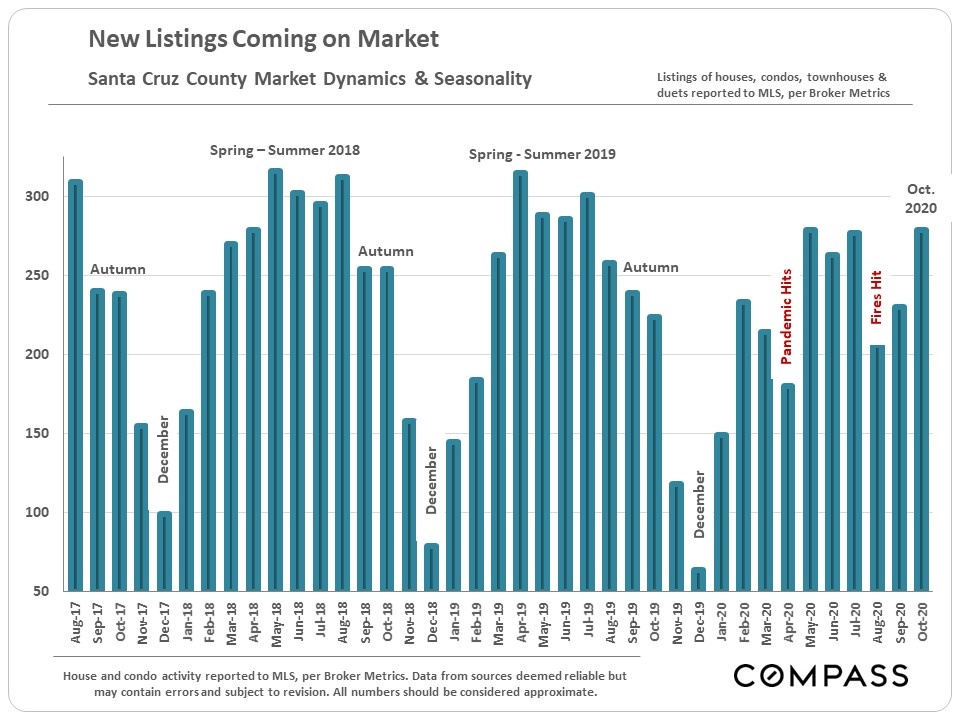
An illustration of the effects of seasonality as well as of 2020’s disasters on new inventory coming on market.
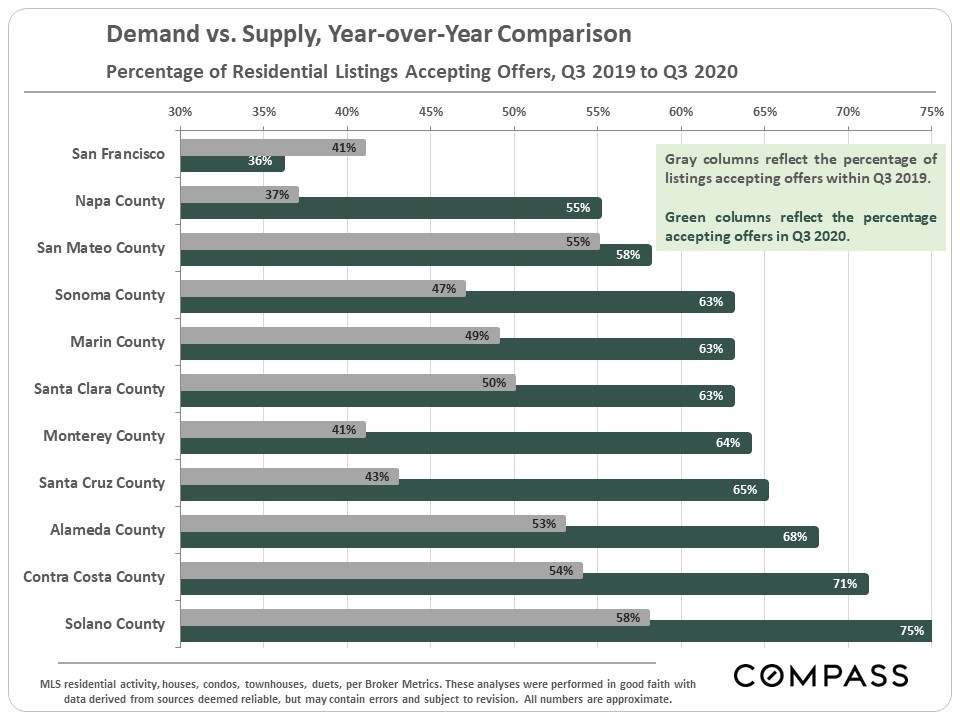
Along with Monterey and Napa Counties, Santa Cruz County saw a stupendous (51%) year-over-year increase in the percentage of listings accepting offers. This was clearly fueled by buyers looking for lower population density locations, better quality of life, and/or more affordable home prices.
By this measure, San Francisco was the only county to see a year-over-year decline in demand, due mostly by a substantial weakening in its large condo market.
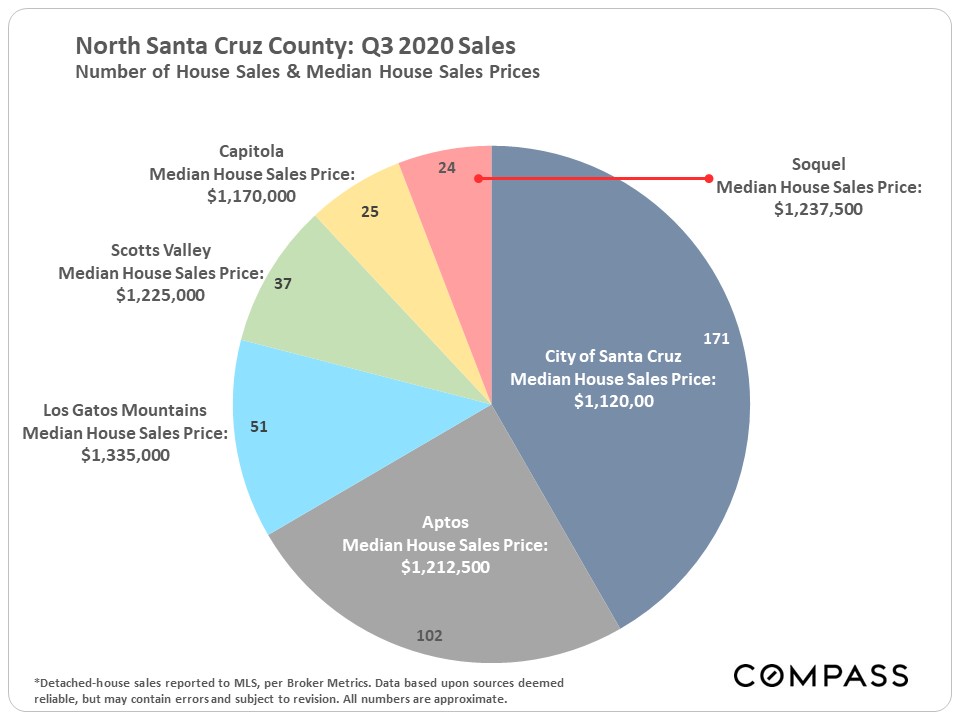
Prices & Market Dynamics in North Santa Cruz County Cities
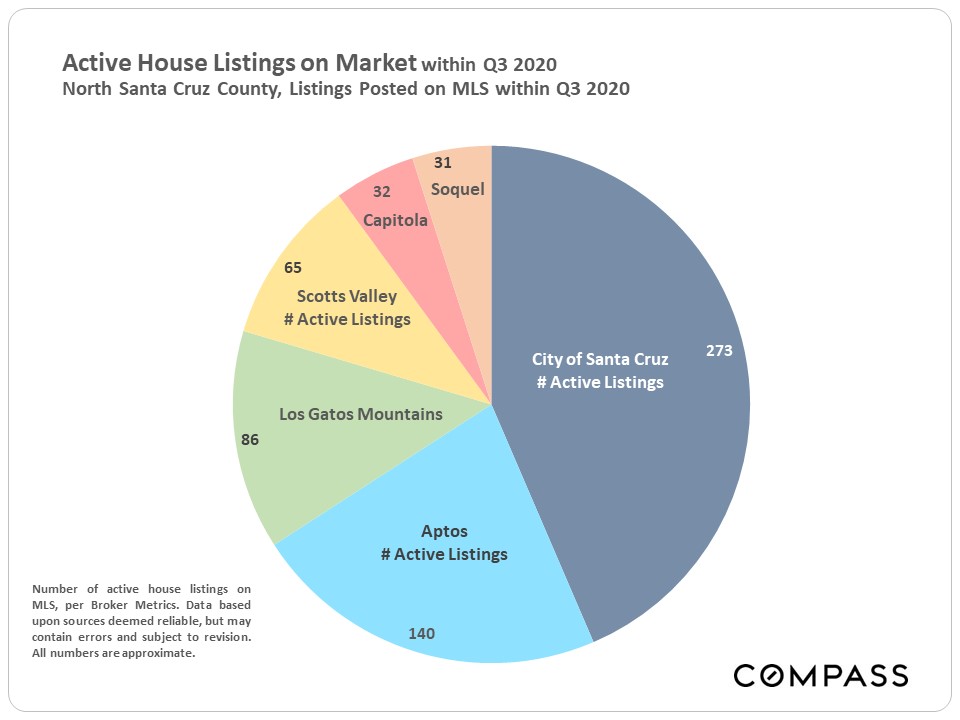
Following is a series of analyses that look at city sales volumes, median house sales prices, listings for sale, and 3 other measurements of supply and demand.
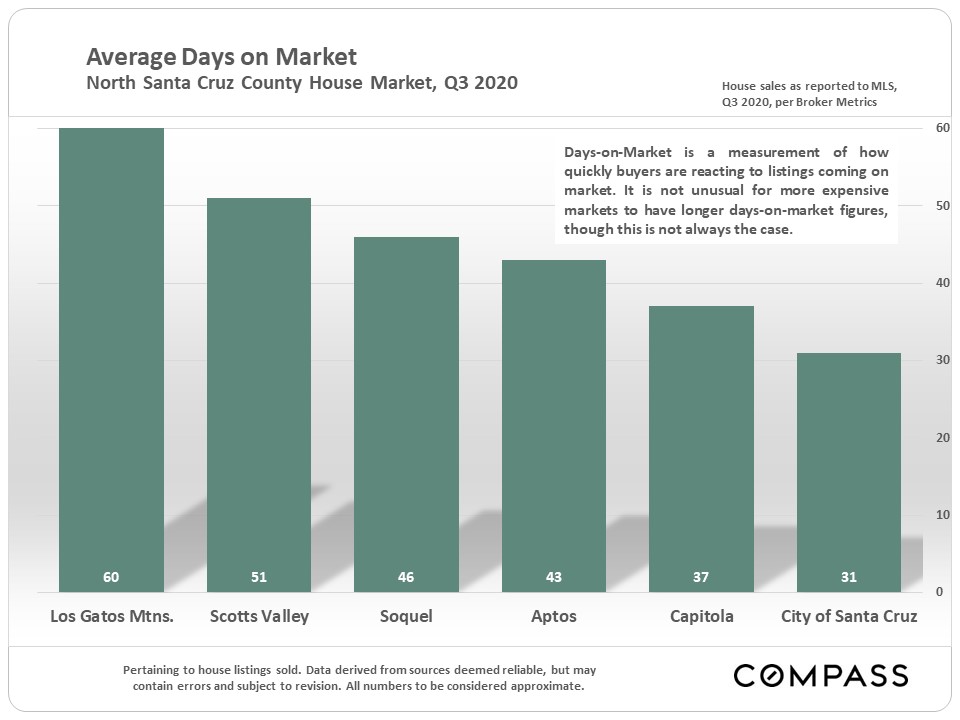
The region described by Realtors as the Los Gatos Mountains was severely impacted by the CZU fire. This region also has the highest median house sales price, which also affects market indicators.
Regarding the next chart: Percentages of 50% or more would typically be considered to reflect a high-demand market. Over 60% signifies very high demand, or as it climbs, extremely high demand, as compared to the supply of listings for sale. You can see that Capitola in particular has gone crazy, and Aptos is not far behind.


Time to talk to a REALTOR?