
The headline news for the Santa Cruz Real Estate Update April 2015 is that the Santa Cruz median home price has returned to its peak – or nearly so. The median price for single family homes in Santa Cruz county in March 2015 was $775,000. This represents a 15.7% increase from the median price a year ago ($670,000) and a 10.7% jump from the month before. We are now just a hair’s breadth – 1.8% – below all-time high of $789,500 set in November of 2005.
Given the fact that home prices are now pretty much as high as they have ever been, a lot of people are going to be asking, again, if we are in a market bubble…or is today’s real estate market fundamentally different? Might the inevitable bubble talk be overblown?
Everyone wants to know…

To answer that question, let’s take a trip down memory lane. While the all-time high median price was reached in November 2005, prices did not fall off a cliff the next month. Rather, they appeared to plateau for nearly two years. In July 2006, the median price was $772,500 and in May 2007 the price was was $779,000, in August 2007 the price was $780,000.
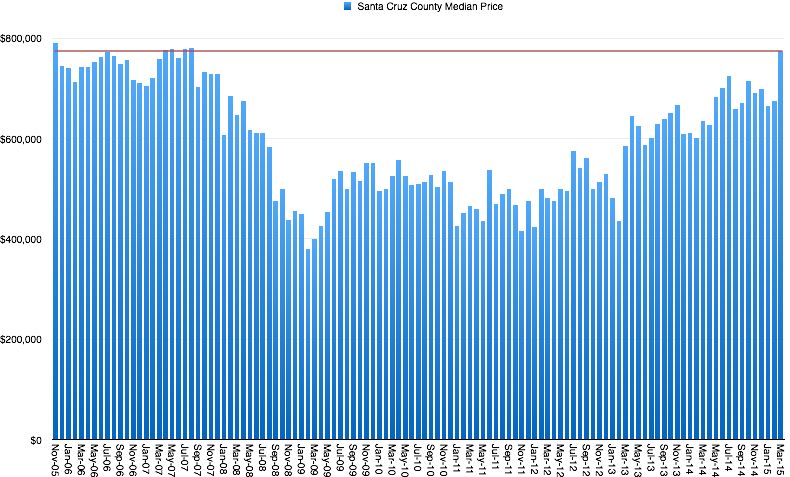
Santa Cruz Median Home Price
November 2005 through March 2015
But the next month in September ’07 the price was $702,000 and in January 2008 the price had dropped precipitously to $606,000. Ultimately, the bottom was reached in February 2009, when the median price hit $380,000 – a drop of 52% in median price in the span of about 38 months. And now, 61 months later, we are back nearly to the peak again, as shown in the chart provided here.
Is history bound to repeat itself? Or now, nearly ten years later, are things so different that a median home price in the high $700,000’s is sustainable? What’s different today compared to the last time home prices were at this level in Santa Cruz county?
Time to talk to a REALTOR?

What’s Different Today vs. 2005
There are several factors which characterize today’s real estate market that are indeed different from the bad old days. The first of these is market rent. I don’t have hard rental data like I do home price data. However, I talk to a lot of people in the rental market, and it seems as though monthly rental prices are up by about 40-50% compared to what they were 8-10 years ago. For people who can actually afford to buy a home today, they won’t be paying much – if any – more to own than to rent, after considering their mortgage interest tax deduction. The last time prices were this high, the cost differential between renting and owning was considerably greater. For many people today, owning a home – even at these prices – seems to pencil out.
Another factor is that in today’s market, lending standards are much, much stricter than they were before. In 2005, if you could fog a mirror, you could get a loan. “Liar loans,” “no doc loans,” “stated income” – all you needed was a good credit score to take out a loan for hundreds of thousands – even a million! – dollars. You just told the bank how much you made, and they’d give you a loan, based on your good credit and undocumented, stated income.

It was raining easy money back in 2005
100% financing was also popular in this time. You could buy a home with literally nothing down, as even your closing costs could be rolled into the purchase price – which really means banks were handing out 103% financing on a regular basis. Today, 100% financing is virtually non-existent, except in the case of VA or USDA loans, which both make up a very small part of the overall mortgage market. In addition, we now have the Qualified Mortgage Standards which prohibits lenders from making loans which consumers will be unable to repay.
Find your Place

Interest rates today are also considerably lower than they were in 2005. A 30 year fixed conventional loan has a rate today around 4%, and jumbo loans are perhaps only 0.25% higher. In November 2005, a 30 year fixed rate conventional mortgage averaged around 6.3%. Back then, a $417,000 loan would have cost you $2,581 per month. Today, that same loan will cost just $1,991 per month, a savings of $590 or roughly 23%.
Another key factor is wage growth. Believe it or not, per capita income in California is higher today than it was in 2005. According to the U.S. Department of Commerce’s Bureau of Economic Analysis, the per-capita median income in California in 2005 was $38,964, whereas in 2014, it stood at $50,109 – an increase of nearly 22%.
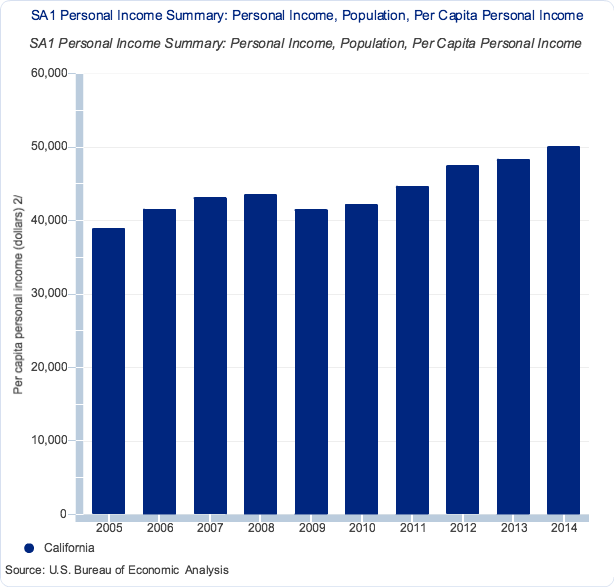
California Income Per Capita 2007-2014
In summary, this is what’s different in 2015 compared with 2005:
1) Rents are substantially higher
2) Credit standards are significantly tighter
3) Few buyers are using 100+% financing to buy
4) Mortgage rates are considerably more affordable
5) California per-capita income is appreciably higher

The Fix is in…a Smoke Filled Room
Of course, as Mark Twain used to say, there’s lies, damn lies, and statistics. Some of this data may be incorrect, mis-reported, or outright fabricated by evil men in expensive suits in smokey wood paneled rooms somewhere far away. Please, take it all with an appropriate number of salt grains.
Whatever the true and correct numbers are, the housing market, the mortgage market, and the economy are in fact markedly different than they were the last time we saw home prices in Santa Cruz at this level.
So is history bound to repeat itself? I don’t know – but doesn’t it always? Cyclical boom and busts are a feature of the United States economy – those guys in the smokey wood paneled rooms like it that way.
What I know for sure is that prices today are very very close to the all-time peak. Inventory remains critically low, and despite the very difficult climate for buyers – they’re out there, clamoring for the few homes that are available. It remains an excellent time to sell a home in Santa Cruz county – the big question is, for how much longer? For that, I have no answer. I don’t think anyone does.
Concierge Services

The Rest of the Story
Sales volume in March 2015 was 123 units sold – that’s an increase of 26.8% compared to the month before, and up 7% from a year ago, when 115 homes were sold in March of 2014.
Inventory shot up in March: we ended the month with 255 homes available for purchase in Santa Cruz county, and that’s an increase of 20.3% in a single month – and that’s great news for buyers! But we should keep a little perspective on this: inventory was still 35.6% below the level of a year ago, when 396 homes were available for sale.
The sales-to-list-price ratio came in at 100.4% last month – another indication of a hot seller’s market. The month before, sellers received just 98.7% of full asking price, and a year ago sellers receive 99.4%.
The average days on market for sold properties continued to drop as well: homes sold in an average of 49 days, which is a 21.9% drop compared to the month before, and 1.2% drop compared to a year ago, when homes sold in 50 days on average.
Please share my newsletter with anyone you think is interested in what’s going on with the Santa Cruz real estate market – just send them the link and they can sign up to receive an e-mail every month when the newsletter is ready. Thanks so much for taking the time to read this – I hope to hear from you soon!
Ready? Get It Sold.