This morning I watched a new YouTube video that had recently been posted which touched on the 7-10 Year Real Estate Cycle. The video’s author encouraged all Realtors to differentiate their message to the public by not talking about how hot the market is, but rather, about how we’re about to reach the end of it. Ever alert for a shifting real estate market, I tuned in and watched.
The thrust of the argument of the video was that the real estate market is cyclical: it goes up, it comes down, and we are right now nearing a market peak which, according to the video’s author, we’ll hit in 6-18 months. The interesting thing about this video is that there was no actual data given to show how this will happen, other than the axiom that the real estate market is like a clock, and that it cycles every 7-10 years.
This is something I’ve heard many times over the years, and it got my brain going. It’s not like I myself haven’t ever predicted that the market is about to turn, just like I’ve recently predicted that 2016 is going to be a banner year for real estate in our area. Based on the invisible hand of the 7-10 year real estate cycle, might 2016 prove to be a peak year for Silicon Valley real estate?
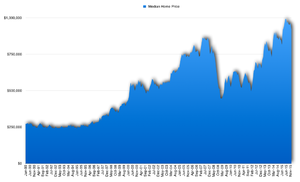
Being something of a data geek, I went looking for the data. I was looking specifically for Santa Clara county historical pricing data – and I could only find prices back through January of 1990. That’s about 25 years though, so if the real estate market does in fact run in 7-10 year cycles, we’d expect to see 2-4 cycles in that period. You can click on the chart below to get a bigger picture:
Of course, the chart is a series of spikes, it’s not a smooth progression up or down (for the most part, the crash of 2008 being a special exception). Prices go up and down from month to month, and from year to year. Generally speaking though, we see a fairly steady rise in prices from January of 1990 (median price: $271,840) until hitting a peak of $813K in June of 2006. At the end of the chart, December 2015, the median home price is at $920,000.
Could 2016 be a peak year for Santa Clara county home prices, and it will be 7-10 years before the next peak? It’s hard to come to that conclusion based on historical data – June 1996 doesn’t seem to have been much of a peak (median price: $279,942), nor June 1999 (median price: $440,000).
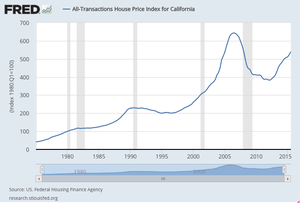
So I went looking for some more data. The next best data source I found came from the Federal Reserve Bank of St. Louis, which provided data from Q1 of 1975 through Q3 of 2015 – for the entire state of California, not just Santa Clara county.
The data show that Q1 1990 (where the Santa Clara county data begins on the chart I provided) was the start of an 18 month plateau, followed by about 3.5 years of modestly lower values (down about 10%), followed by 10 years of pretty consistent increases until peaking at $644K in the 3rd quarter of 2006 – ten years later.
Ah ha! There it is: 10 years from peak to peak. I would argue, though, that there’s no magic about a 7-10 year period. As you can see from the 25 years of Santa Clara county pricing data, prices go up and down much faster than every 7-10 years – and that clearly identifiable long periods of overall price increases can run much longer than 10 years.
Our local real estate market data do not show any clear pattern of 7-10 year boom-and-bust cycles in the real estate market. Actually, it seems to me that price rises and decreases are more closely correlated with the state of the overall economy – are we in recession, stagnation, or growth? Putting aside 2008, it looks like most price drops happen during, or just after, major recessions – such as 1990-1991 and after the dot-com bubble explosion in 2000.
In my research, I stumbled across a posting on Bigger Pockets, which is one of the best real estate blogs on the Internet for serious real estate geeks. Check out what they had to say about real estate cycles in this posting from March 2015:
https://www.biggerpockets.com/renewsblog/2015/03/06/real-estate-marketanalyze-predict/
This article cites work by acclaimed economists who have spent years analyzing the data and have come to the conclusion that actually, real estate markets tend to run in 18 year cycles. Having said that, it does of course depend on what real estate market you are talking about: residential, commercial, agricultural? Rental, purchase? San Francisco, or Detroit? If we’re talking residential real estate in Santa Clara county, an 18-year cycle means it’ll be 2024 before we hit the next real estate peak.
Of course, past performance is no guarantee of future results. 2016 could be a peak year for home values and we’ll be looking at years of price declines for years to come after this. But if so, it won’t be because we’re at the end of a 10 year cycle. As the Bigger Pockets article mentions, there will be some other stimulus to bring about a market bust – most likely, another recession.
Recessions come, recessions go. It’s difficult to know exactly when one will hit, how long it will last, or what effect it will have on the real estate market. One thing though is abundantly clear: over the long term, Silicon Valley real estate prices have risen substantially, and should continue to do so as long as we continue to churn out high paying jobs. When that stops happening – as it did in Flint, Michigan – it’s going to get ugly. Let’s hope though that day is a long time in coming.
The year 2016 may or may not be a “peak” real estate year, but one thing’s for sure: the combination of ultra-low inventory, historically low interest rates, and intense buyer demand does make this an A-MAZING time to sell your home in the Silicon Valley Area. Please feel free to contact me at any time for a no-hassle, no-obligation consultation on what we can do to get you the very highest price possible for your home in this smokin’ seller’s market.


