Key takeaways
Summary: Spring 2026 is starting slower than normal in Silicon Valley, with softer demand and rising caution. If inventory keeps growing, sellers may benefit from moving earlier rather than later in the season.
Super Bowl Sunday is behind us (go Seahawks!) and that usually marks the unofficial kickoff of the spring selling season here in Silicon Valley. Historically, our market begins stirring in mid-January after taking six to eight weeks off during the holidays. But once we’re past the Super Bowl, the gloves typically come off. Listings ramp up. Buyers flood open houses. Multiple offers become routine.
This year, however, the market hasn’t exactly come charging out of the gate. It feels more cautious than explosive. The data from January 2026 suggests that while activity has resumed, the intensity we often expect at the start of spring simply isn’t there.
Prices Are Softening at the Margin
Let’s begin with the headline numbers. In January 2026, the Santa Clara County single-family median sold price was $1,740,000. That represents a 3.3% decline compared to January 2025. The median price per square foot came in at $1,048, down approximately 2% year-over-year.
A 2–3% dip may not sound dramatic in isolation. But context matters. Silicon Valley real estate has historically relied on steady appreciation fueled by job growth, stock wealth, and intense supply constraints. A year-over-year price decline at the very beginning of what should be the strongest part of the year deserves attention, especially for long-time homeowners looking to capitalize on what is normally the best time of the year to sell a home.
Closed Sales Show a Meaningful Drop in Demand
Even more telling than sinking prices is transaction volume. In January 2026, 320 single-family homes closed escrow in Santa Clara County. That’s down 16% compared to January 2025. Compared to December 2025, the month prior, closed sales were down 36%.
Seasonality explains some of the month-over-month decline; December often benefits from contracts signed earlier in the fall. However, a 16% year-over-year decline in closed transactions is significant. Closed sales represent actual completed deals – buyers who secured financing, signed documents, and funded the purchase. When that number falls meaningfully year-over-year, it signals weaker effective demand.
Pending sales provide another prism through which to view the market, and this one isn’t so bad. In January, 447 homes went under contract, up 2.8% year-over-year. That modest increase suggests buyers are still active, but not in the forceful way we would expect if confidence were surging. And it’s important to note that pending sales is not the same thing as closed sales, and that nationally, contract cancellations have also been elevated, at or near record levels.
Sell As-Is. Sell Easy. Sell Smart!

Inventory Is Expanding Faster Than Sales
Inventory dynamics may be the most important story of all. Santa Clara County ended January with 614 single-family homes actively listed for sale. That is up 6% year-over-year, and that’s really no big deal. But months of inventory – a metric that measures how long it would take to sell all active listings at the current pace of sales – rose to 1.9 months. That’s up 25% compared to last year and up 105% compared to December.
In other words, relative to buyer demand, available supply has effectively doubled month-over-month. While 1.9 months of inventory is still low compared to many U.S. metro areas (where 4 to 6 months is considered balanced), Silicon Valley historically operates at extremely tight supply levels. A move from ultra-tight to borderline balanced changes the seasonal outlook considerably.
New listings totaled 731 in January, up 5% year-over-year. That increase is normal for this time of year. But again, it’s not the number listings, new or otherwise, that is of concern here. The much more important consideration is that the number of listings relative to demand is soaring. Months of inventory isn’t growing because homeowners are listing their homes for sale in much higher numbers – rather, it’s because buyers aren’t showing up to buy what’s for sale.
Homes Are Selling Quickly…But Slower Than Last Year
The median days on market in January 2026 was 10 days. That remains one of the fastest median marketing times of any major metro area in the country. However, that 10-day figure is 25% higher than January 2025. A 25% slowdown in velocity, even from a very fast baseline, indicates cooling momentum.
The sale-to-list price ratio also softened slightly. The average home sold for 103% of its list price. Last year at this time, that number was more like 104%. And that sounds good, but remember, sellers in Silicon Valley typically underprice their homes to create bidding wars. In strong Silicon Valley markets, it is common to see sale-to-list ratios between 106% and 109%. In this context, a 103% sales-to-list-price ratio is actually pretty weak, not the sign of a robust market by any stretch of the imagination.
Your Neighbor Sold their House too Cheap!

This Isn’t Primarily a Mortgage Rate Story
I keep on hearing, over and over, that if only mortgage rates were lower, buyer activity would pick up. Yet mortgage rates today are the lowest they’ve been in roughly two and a half years. Even so, buyer enthusiasm remains subdued. That suggests something deeper is influencing behavior.
Affordability Is The Real Issue
Rather, affordability is emerging as one of the most consequential forces shaping the 2026 housing market. The Compass 2026 Housing Outlook makes the point clearly: in many parts of the country, there is already enough unsold inventory to keep a lid on price growth. But beyond supply, affordability itself may be the real constraint. Today’s home prices appear significantly disconnected from underlying household incomes. In other words, even if demand exists in theory, the math increasingly doesn’t work in practice.
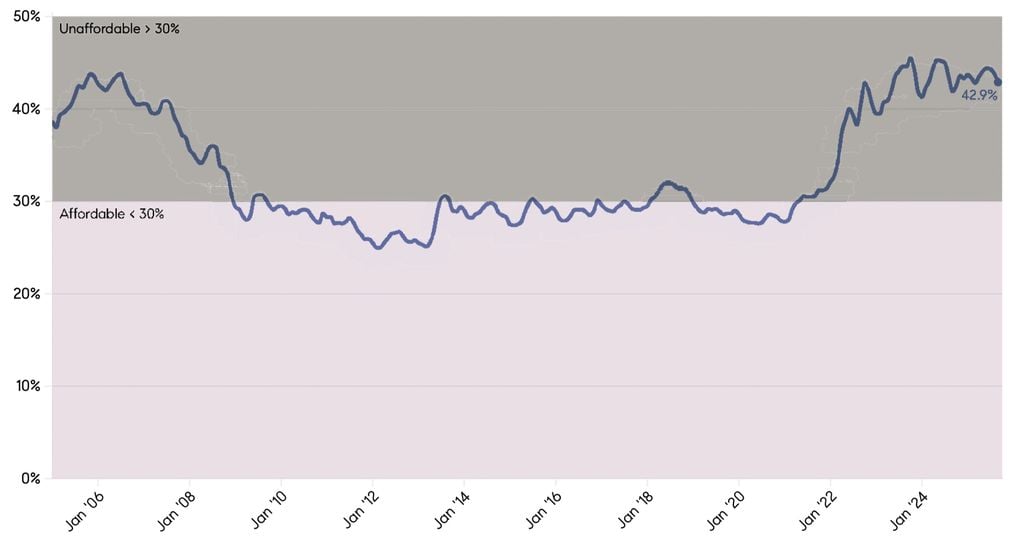
The Federal Reserve Bank of Atlanta’s Affordability Index highlights how distorted conditions have become. For most of the 2010s, typical housing expenses consumed less than 30% of median household income, a level generally considered sustainable. Today, that ratio sits above 40%, near the highest point of the past two decades. Crossing from 30% to 40% may not sound dramatic, but it represents a massive shift in household financial strain. When more than two-fifths of income goes toward housing alone (and that’s before accounting for rising costs of food, utilities, insurance, and medical care), buyers become far more cautious. That strain doesn’t just affect first-time buyers; it limits move-up demand, reduces bidding intensity, and makes price appreciation harder to sustain without meaningful wage growth.
It’s No Better in Silicon Valley
In Santa Clara County, the national affordability crisis is magnified into a structural divide where the “math” only works for the region’s highest earners. While the rest of the country grapples with a 40% housing-to-income ratio, local single-family home prices (which for most of 2025 was pushing up close to $2m) require a household income of roughly $480,000 to comfortably qualify.
This has created a K-shaped market where high-end demand is propped up by immense AI-driven wealth and stock liquidity, while middle-class and non-tech professionals are effectively priced out. Even as inventory levels see a modest rise in 2026, the scarcity of ready homes keeps competition fierce in the top 5% of the market, with most properties selling in under three weeks. While the median home price is being sustained by the top tier of the market, the struggle in the bottom 90% is real and becoming clearer every day.
The Mortgage “Lock-in Effect” is Fading
Another factor that puts upward pressure on inventory is by the winding down of what economists call the mortgage lock-in effect. Millions of homeowners secured historically low interest rates in 2020 and 2021, often between 2 and 3 percent. Selling would have required replacing those loans with mortgages at double the rate, creating a powerful financial incentive to stay put. But according to Compass’s 2026 Housing Market Outlook, that dynamic is beginning to ease as more homeowners now hold mortgages closer to current rate levels, reducing the financial penalty associated with moving.
As this lock-in effect fades, Compass expects more homeowners to enter the market, contributing to a meaningful increase in inventory in 2026. For both buyers and sellers, this signals a market that is becoming less constrained and more functional than it has been in recent years. That’s good news for buyers as it should mean more sellers will come in to the market, but does add to the likelihood of considerably more inventory (competition for sellers) going forward.
Labor Market Revisions Raise Red Flags
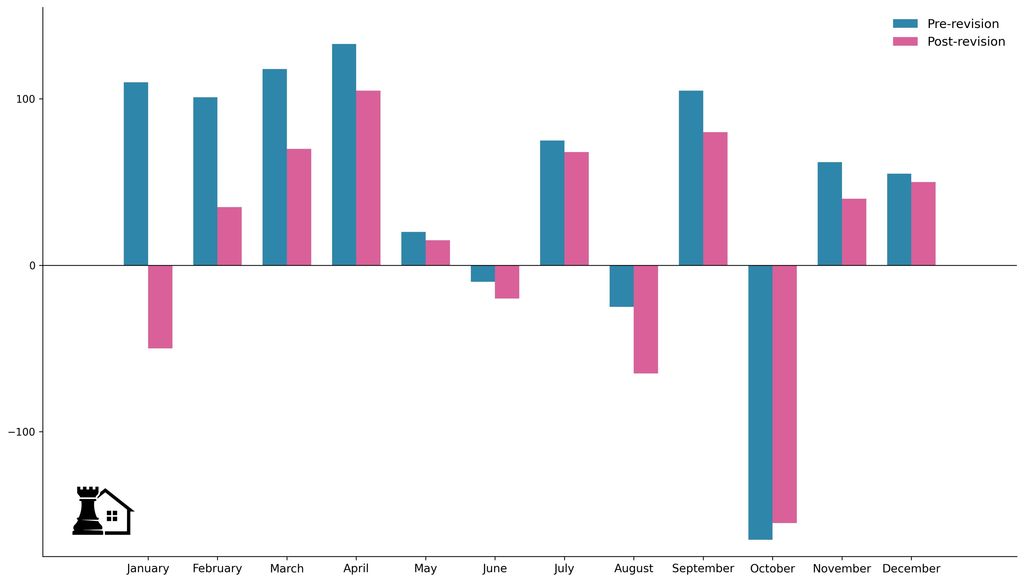
Recent labor data adds another layer of caution. The Bureau of Labor Statistics initially estimated that 584,000 jobs were created nationwide in 2025. Following benchmark revisions, that number was adjusted downward to 181,000 jobs created. That represents a 69% reduction from the previously reported figure.
Job growth is a fundamental driver of housing demand. Fewer jobs mean fewer new households with the income stability required to purchase homes. When job creation is revised downward so dramatically, it changes the narrative about economic strength.
Foreclosure Rates Are On The Rise
At the same time, foreclosure filings are increasing nationally. Completed foreclosures were up 59% in January 2026 compared to January 2025. Mortgage delinquencies are up approximately 30% year-over-year.
While foreclosure levels remain far below the extremes seen during the 2008 crisis, the direction of change is notable.
The Stock Market and the AI Effect
Silicon Valley housing is uniquely sensitive to equity market conditions. A significant percentage of local buyers rely on stock-based compensation, IPO liquidity, and portfolio gains to fund down payments or all-cash purchases.
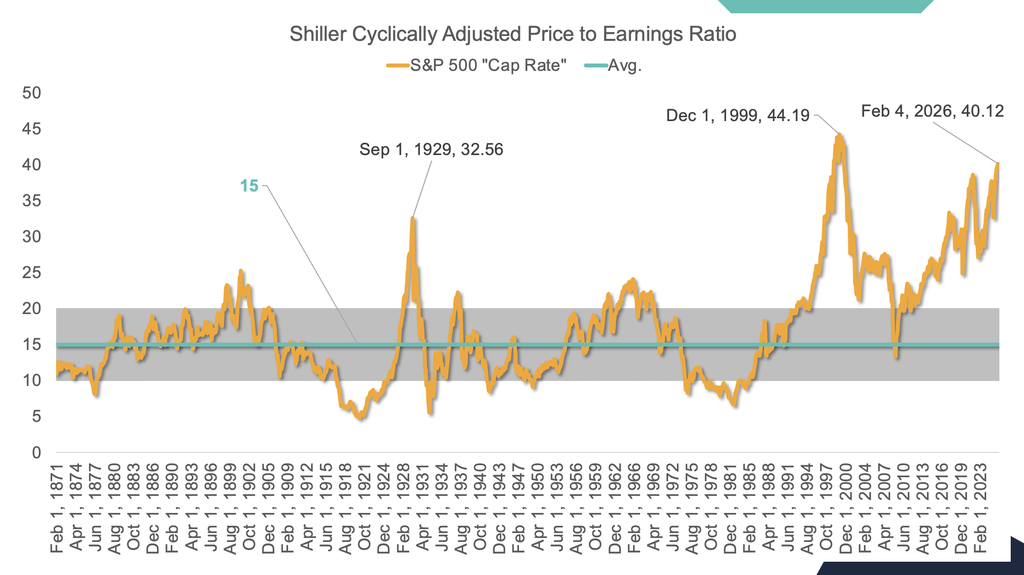
The S&P 500 currently trades at a price-to-earnings ratio of approximately 40.12. During the dot-com bubble, that ratio peaked around 44.19 before collapsing.
Today’s optimism centers on artificial intelligence. Hundreds of billions of dollars have been invested into AI-related companies, many headquartered in the Bay Area. That capital influx has created substantial paper wealth for a concentrated segment of the workforce.
If those investments generate sustainable earnings growth, housing demand could remain resilient. However, if returns fail to materialize and investors begin repricing risk, equity markets could correct sharply. Given the wealth effect’s influence on local real estate, a market correction would likely translate into reduced housing demand.
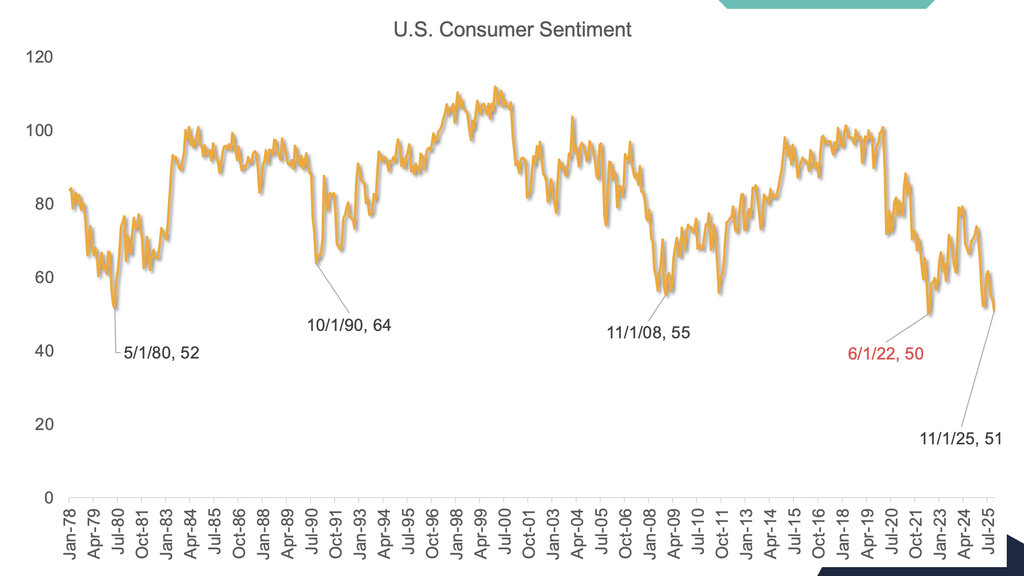
Consumer Sentiment is at a 45+ year Low
Consumer sentiment recently hit its lowest point in roughly 45 years (aside from 2022, after mortgage rates skyrocketed that spring), a level that even undercut readings from the 2008 financial crisis. When consumers feel uncertain about the economy, their jobs, or their financial future, they tend to postpone major purchases—homes included—because buying a house isn’t just about affording a mortgage payment, it’s about confidence that income and wealth will remain stable.
Low sentiment tends to cool buyer demand, reduce bidding wars, and slow overall transaction velocity, because people reflexively become cautious; they delay listing their homes, negotiate harder on price, or simply sit on the sidelines waiting for clarity. In real estate markets, sentiment is a psychological fuel: when it’s strong, buyers compete aggressively and sellers have leverage; when it’s weak, buyers hold back, sellers face more competition, and the pace of sales decelerates, which often translates into softer prices and longer marketing times.
Comparisons to Prior Cycles
Silicon Valley has experienced sharp cycles before. The dot-com bust in the early 2000s led to significant home price declines and prolonged recovery in certain submarkets. The 2008 mortgage crisis triggered widespread distress, short sales, and foreclosures.
Today’s conditions are not identical to either of those episodes. Lending standards remain far stricter than in 2006–2007, and homeowners generally possess substantial equity buffers.
However, the combination of stretched valuations, weakening job growth, rising foreclosure activity, and historically low consumer confidence warrants careful observation.
The Market is Soft Coast to Coast
It’s not just Silicon Valley that’s gone cold; actually, we’re doing better, of course, than most of the country. National coverage on January 2026 existing-home sales had an unusually sharp edge, largely because of what NAR chief economist Lawrence Yun said alongside the data. Realtor.com reported that existing-home sales fell 8.4% from December to a seasonally adjusted annual rate of 3.91 million, even as mortgage rates averaged about 6.1% for the month.
Amid the sharp slide in U.S. existing-home sales in January, Yun went much further than his usual optimistic commentary, telling some outlets that the downturn feels uniquely severe. In coverage highlighting the market’s struggles, Yun was quoted as saying, “The movement is not happening. Americans are stuck,” and characterized the situation as a “new housing crisis” in light of how sharply sales have fallen even as mortgage rates eased. His remarks underscored that the drop in transactions isn’t simply a seasonal blip but reflects deeper hesitancy among buyers in the face of affordability challenges and economic uncertainty (see The Independent and related coverage).
Yun was further quoted as saying: “The decrease in sales is disappointing,” and he noted that extreme conditions muddied the read: “The below-normal temperatures and above-normal precipitation this January make it harder than usual to assess the underlying driver of the decrease and determine if this month’s numbers are an aberration.” He also emphasized how uneven the slowdown looked, telling reporters, “It’s really puzzling,” after the West posted the biggest regional decline despite much, much less weather impact (see: Realtor.com and CNBC).
Downsizing Done Right

What This Means for Silicon Valley Sellers in 2026
Real estate markets operate on confidence and momentum. When buyers feel secure about employment, portfolio values, and economic stability, they compete aggressively. When uncertainty rises, they hesitate. And current data suggest that hesitation is increasing.
Inventory is building, and closed sales are down meaningfully year-over-year. Homes are taking longer to sell, overbids are less aggressive. National economic indicators are mixed at best, and have even spooked the perennially sanguine chief economist for the National Association of REALTORS.
For homeowners considering selling in 2026, timing may matter more than usual. Inventory typically expands as spring progresses into summer. If demand remains muted while supply grows, competition among sellers intensifies.
Last spring provided a reminder of how quickly sentiment can shift. External shocks (such as those tariff-related developments we experienced last year) altered buyer psychology mid-season. Sellers who waited for peak spring activity found themselves navigating a much softer environment than anticipated.
No one can predict with certainty how 2026 will unfold. Silicon Valley has repeatedly demonstrated long-term resilience. But relying solely on seasonal optimism may not be prudent this year, as there are many warning lights flashing red.
Final Thoughts
The 2026 spring market has begun, but it has not roared out of the gate. Prices are modestly lower year-over-year. Closed sales are down 16%. Inventory is up 6% and months of inventory has climbed 25% year-over-year. Days on market are 25% longer. Sale-to-list ratios are cooler. Consumer confidence is at a 45-year low. Job creation was revised downward by 69%. Completed foreclosures are up 59%, and mortgage delinquencies are up 30%.
Individually, each statistic might be manageable. Collectively, they suggest a market that is nowhere near so robust as many had been expecting only a few weeks ago.
If you’re considering selling this year, evaluating your timing and pricing strategy carefully could make a meaningful difference. The earlier part of spring may offer stronger conditions than late spring or summer if inventory continues to expand without a corresponding surge in demand.
If you would like to discuss what these trends mean specifically for your neighborhood and price range, contact me at any time. I’m happy to walk through the data and help you make a well-informed decision about your next move.
Frequently Asked Questions
Why does the spring 2026 Silicon Valley market feel weaker than normal?
Because demand is softer. Buyers are still out there, but more of them are hesitating—either because affordability is stretched, confidence feels shaky, or they’re simply not willing to “pay any price” the way they might in a hotter spring market.
Is this weakness mainly about mortgage rates?
Mortgage rates matter, but the bigger issue is affordability and confidence. Even if rates ease a bit, the monthly payment can still feel brutal at Silicon Valley price points. When people don’t feel good about the payment or the economy, they wait.
What are the early warning signs that demand is weakening?
The biggest tells are fewer closed sales, more days on market, fewer offers per home, and buyers negotiating harder on price, repairs, and credits. You also see more “almost offers” where buyers watch a home for a week before acting.
Does a weaker start mean home prices will drop?
Not automatically. Prices can stay surprisingly sticky, especially in strong micro-markets and for homes that show well and are priced strategically. But if demand stays soft while inventory grows, sellers lose leverage—and that’s when pricing pressure can show up.
How does rising inventory affect the spring market?
Inventory creates choice. Choice creates leverage for buyers. And leverage usually shows up as slower sales, fewer bidding wars, more contingencies, and more negotiation. In Silicon Valley, the market can still be competitive—just less forgiving for overpriced or poorly presented homes.
If I’m thinking about selling in 2026, should I list earlier or later in spring?
In a softer year, earlier can be better. Inventory tends to build as spring progresses, which means more competition later. Listing earlier can put you in front of buyers before they’re drowning in options.
What can sellers do to succeed if spring 2026 stays weaker?
Get the three controllables right: price, presentation, and positioning. That means strategic pricing (not “wish pricing”), clean disclosures, strong marketing, and a home that shows confidently. In a softer market, buyers punish uncertainty.
How can buyers take advantage of a weaker spring market?
Buyers may get more breathing room—more time to think, more negotiation power, and fewer “take it or leave it” situations. The best approach is to stay ready and focus on value: condition, location, long-term usability, and downside protection.
Is the slowdown happening evenly across Silicon Valley?
No. Silicon Valley is a collection of micro-markets. One school district can feel hot while another feels slow. Condos can behave differently than single-family homes. Even within the same city, two neighborhoods can move at different speeds depending on inventory and buyer profile.
How do I know what this means for my neighborhood specifically?
You look at the micro-data: active listings, new listings, pendings, recent sales, days on market, and sale-to-list ratios for your immediate area and price band. Broad county stats are useful, but pricing a home correctly requires neighborhood-level reality.
Time to talk to a REALTOR?

Senior Friendly Homes in Silicon Valley South
2
3
4
5
6
7
8
9
10
11
12
13
14
15
16
17
18
19
20
21
22
23
24
25