
San Mateo County housing market: November 2026 update
Data through October 2026. Updated November 20, 2026.
San Mateo County home price key metrics
Current market statistics for San Mateo County homes over the last 3 months, through October 2026:
- Homes sold: 1,352 (Aug 2026 to Oct 2026)
- Median sale price: $1,721,395
- Median price per square foot: $1,043
- Median days on market: 14
- Average sale price to list price: 105.0%
- Sold above asking: 58%
- Months of supply: 1.7
- Price per square foot, average yearly change over 5 years (2021 to 2026): 1.4%
- Price per square foot, average yearly change over 10 years (2016 to 2026): 3.7%
Strong seller's market. Seller conditions rate 9 out of 10 and buyer conditions 2 out of 10, based on home sales over the last 3 months through October 2026 compared with a year earlier.
What's my San Mateo County home worth?
See what your home is really worth with multiple valuations side by side, each with a confidence score so you know which number to trust. It updates as the market moves, so you'll always know where your equity stands.
As of November 20, 2026, San Mateo County is in a strong seller's market. The median sale price climbed to $1,721,395, up 5.6% versus the same period a year earlier, though prices have dipped 1.1% from the previous three months as the market enters its quieter season. Homes are moving briskly: the median time on market is 14 days, five days faster than a year ago, and nearly half of all homes went under contract within two weeks. Sellers are capturing premium pricing, with an average sale-to-list ratio of 105.0% and 57.9% of homes selling above asking price, up 8.2 percentage points year-over-year.
Supply remains a defining constraint. Inventory stands at 753 homes, down 6.0% versus last year, while months of supply sits at 1.7, unchanged year-over-year but historically tight. New listings came in at 1,638, down just 1.2% from a year earlier, yet homes sold totaled 1,352, down 7.0% year-over-year. The drop in sales volume and pending sales, which fell 11.3% year-over-year, reflects fewer buyers in the market during the seasonal slowdown. With fewer homes available than buyers seeking to purchase, negotiations strongly favor sellers.
Over the longer term, the typical home value in the county stands at $1,579,058, up 0.5% year-over-year. Rental demand has surged, with average rents climbing 11.8% to $3,993 per month, translating to a gross rental yield of 3.0% annually.
What's behind the rating
- About 1.7 months of supply. Under 3 months usually means more buyers than homes for sale.
- Homes sold for 105.0% of list price on average, and 58% sold above asking.
- The typical home was on the market 14 days before going under contract.
- 50% of homes went under contract within two weeks.
San Mateo County market by the numbers
| Measure | Last 3 months | vs. year ago |
|---|---|---|
| Median sale price | $1,721,395 | +5.6% |
| Median price per sq ft | $1,043 | +3.5% |
| Homes sold | 1,352 | -7.0% |
| Average sale-to-list | 105.0% | +2.5 pts |
| Sold above list price | 58% | +8.2 pts |
| Median days on market | 14 days | -5 days |
| Months of supply | 1.7 | 0.0 months |
| New listings | 1,638 | -1.2% |
San Mateo County home prices by year
Each row covers 12 months ending in October, so every year is complete and the years line up with each other.
| 12 months | Median price | Price per sq ft | Homes sold | Sale to list | Days on market |
|---|---|---|---|---|---|
| Nov 2025 to Oct 2026 | $1,687,764 | $1,044 | 5,281 | 104.6% | 16 |
| Nov 2024 to Oct 2025 | $1,655,767 | $1,019 | 5,072 | 103.4% | 19 |
| Nov 2023 to Oct 2024 | $1,627,281 | $1,013 | 4,890 | 104.0% | 20 |
| Nov 2022 to Oct 2023 | $1,538,553 | $975 | 4,442 | 101.6% | 21 |
| Nov 2021 to Oct 2022 | $1,608,553 | $1,040 | 6,156 | 107.2% | 15 |
| Nov 2020 to Oct 2021 | $1,550,463 | $973 | 7,601 | 106.0% | 16 |
| Nov 2019 to Oct 2020 | $1,463,946 | $915 | 6,842 | 102.1% | 30 |
| Nov 2018 to Oct 2019 | $1,390,822 | $893 | 6,648 | 103.6% | 28 |
| Nov 2017 to Oct 2018 | $1,391,995 | $890 | 5,895 | 109.4% | 14 |
| Nov 2016 to Oct 2017 | $1,199,343 | $786 | 5,928 | 106.6% | 19 |
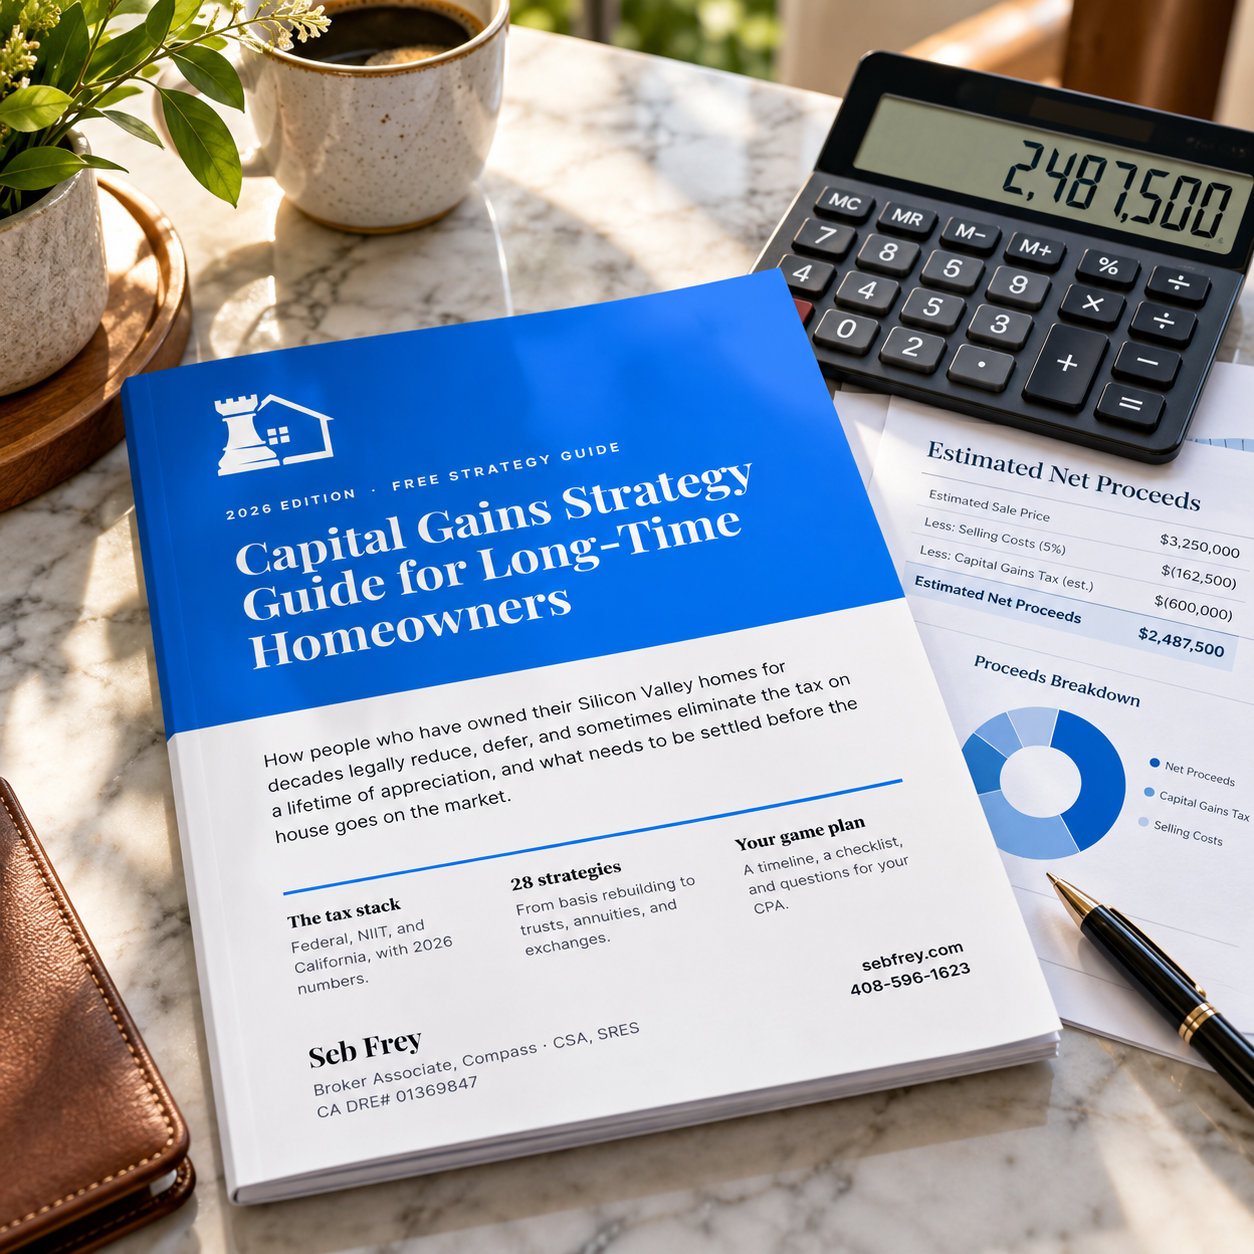
Free 2026 Strategy Guide
28 legal ways long-time owners cut their capital gains tax.Know your options before you list.
If you've owned for decades, your gain may be well past the $250,000 and $500,000 exclusions. Know your options before you list.
- All 28 strategies, explained in plain English
- A real bracket-by-bracket example
- What to settle before your home hits the market
You're all set.Thanks! Your Capital Gains Strategy Guide is on its way to your inbox. If you don't see it in a few minutes, check your promotions or spam folder.
San Mateo County home prices by city
How each city and town in San Mateo County is doing over the last 3 months through October 2026, compared with a year earlier. Places with fewer than a handful of sales in that window are left out.
Atherton · Belmont · Brisbane · Burlingame · Daly City · East Palo Alto · El Granada · Emerald Lake Hills · Foster City · Half Moon Bay · Highlands · Hillsborough · La Honda · Menlo Park · Millbrae · Montara · Moss Beach · North Fair Oaks · Pacifica · Portola Valley · Redwood City · San Bruno · San Carlos · San Mateo · South San Francisco · West Menlo Park · Woodside
Atherton home prices
Strong seller's market. Seller conditions 9/10, buyer conditions 2/10.
- Homes sold: 18 (Aug 2026 to Oct 2026)
- Median sale price: $11,142,250
- Median price per square foot: $2,420
- Median days on market: 9
- Average sale price to list price: 109.4%
- Sold above asking: 61%
- Months of supply: 2.3
- Price per square foot, average yearly change over 5 years (2021 to 2026): 7.2%
- Price per square foot, average yearly change over 10 years (2016 to 2026): 4.8%
Atherton is a strong seller's market where homes sold for 109% of list price on average, with 61% exceeding asking price. Supply has tightened considerably, with just 2.3 months of inventory and homes typically spending only 9 days on the market before going under contract. The median sale price climbed 48% year over year to $11.1 million, though prices moderated slightly from the previous quarter.
Belmont home prices
Strong seller's market. Seller conditions 9/10, buyer conditions 3/10.
- Homes sold: 67 (Aug 2026 to Oct 2026)
- Median sale price: $2,398,332
- Median price per square foot: $1,166
- Median days on market: 14
- Average sale price to list price: 105.7%
- Sold above asking: 60%
- Months of supply: 0.9
- Price per square foot, average yearly change over 5 years (2021 to 2026): 1.6%
- Price per square foot, average yearly change over 10 years (2016 to 2026): 4.3%
Belmont presents a strong seller's market with tight conditions favoring those listing homes. Homes averaged 106% of list price, with 60% selling above asking, while inventory hit just 0.9 months. Despite a modest 4% price gain over the year, volume surged with 52% more homes sold and pending sales climbing 83%.
Brisbane home prices
Strong seller's market. Seller conditions 9/10, buyer conditions 3/10.
- Homes sold: 14 (Aug 2026 to Oct 2026)
- Median sale price: $1,089,242
- Median price per square foot: $754
- Median days on market: 24
- Average sale price to list price: 106.3%
- Sold above asking: 64%
- Months of supply: 1.8
- Price per square foot, average yearly change over 5 years (2021 to 2026): -0.0%
- Price per square foot, average yearly change over 10 years (2016 to 2026): 2.3%
Brisbane is a strong seller's market despite significant year-over-year price declines, with homes selling for 106% of list price and 64% going above asking. Supply remains constrained at 1.8 months, though prices dropped 36% from last year and the typical home spent 24 days on market. The disparity between strong buyer demand and sharp price drops reflects a market in transition.
Burlingame home prices
Strong seller's market. Seller conditions 10/10, buyer conditions 1/10.
- Homes sold: 69 (Aug 2026 to Oct 2026)
- Median sale price: $3,047,880
- Median price per square foot: $1,519
- Median days on market: 14
- Average sale price to list price: 107.1%
- Sold above asking: 63%
- Months of supply: 0.6
- Price per square foot, average yearly change over 5 years (2021 to 2026): 3.4%
- Price per square foot, average yearly change over 10 years (2016 to 2026): 4.7%
Burlingame shows the most extreme seller's market conditions locally, with homes averaging 107% of list price and 63% selling above asking. Inventory has collapsed to just 0.6 months, down nearly 60% from a year ago, while the median price rose 15% to $3 million. Homes typically spent 14 days under contract, though fewer are available overall.
Daly City home prices
Strong seller's market. Seller conditions 9/10, buyer conditions 3/10.
- Homes sold: 105 (Aug 2026 to Oct 2026)
- Median sale price: $1,189,173
- Median price per square foot: $778
- Median days on market: 17
- Average sale price to list price: 108.3%
- Sold above asking: 75%
- Months of supply: 2.3
- Price per square foot, average yearly change over 5 years (2021 to 2026): 0.4%
- Price per square foot, average yearly change over 10 years (2016 to 2026): 3.2%
Daly City is a strong seller's market where homes sold for 108% of list price, with three-quarters exceeding asking. Supply sits around 2.3 months, though homes available have grown 30% from last year while sales volume fell 15%. The median price gained 8% year over year despite declining pending sales, signaling mixed momentum.
East Palo Alto home prices
Balanced market. Seller conditions 6/10, buyer conditions 6/10.
- Homes sold: 27 (Aug 2026 to Oct 2026)
- Median sale price: $1,056,165
- Median price per square foot: $754
- Median days on market: 16
- Average sale price to list price: 99.5%
- Sold above asking: 31%
- Months of supply: 3.7
- Price per square foot, average yearly change over 5 years (2021 to 2026): 0.8%
- Price per square foot, average yearly change over 10 years (2016 to 2026): 2.5%
East Palo Alto shows balanced market conditions with homes selling near list price at 100% on average, though 58% sold below asking. Inventory expanded 28% year over year to 3.7 months, and the median price slipped 5%. Homes moved faster than a year ago, spending 16 days on market, but pending sales declined 20% from the prior year.
El Granada home prices
Buyer's market. Seller conditions 4/10, buyer conditions 7/10.
- Homes sold: 17 (Aug 2026 to Oct 2026)
- Median sale price: $1,548,923
- Median price per square foot: $800
- Median days on market: 59
- Average sale price to list price: 100.6%
- Sold above asking: 18%
- Months of supply: 3.2
- Price per square foot, average yearly change over 5 years (2021 to 2026): 3.3%
- Price per square foot, average yearly change over 10 years (2016 to 2026): 4.7%
El Granada is a buyer's market where 76% of homes sold below list price and inventory grew 38% to 3.2 months. The typical home lingered 59 days on market, up significantly from the previous year, while median prices inched up just 2% despite softer demand. Only 19% of homes went under contract within two weeks.
Emerald Lake Hills home prices
Seller's market. Seller conditions 7/10, buyer conditions 4/10.
- Homes sold: 11 (Aug 2026 to Oct 2026)
- Median sale price: $2,818,040
- Median price per square foot: $1,233
- Median days on market: 16
- Average sale price to list price: 101.6%
- Sold above asking: 64%
- Months of supply: 2.9
- Price per square foot, average yearly change over 5 years (2021 to 2026): 3.6%
- Price per square foot, average yearly change over 10 years (2016 to 2026): 4.9%
Emerald Lake Hills is a seller's market where homes sold for 102% of list price with 64% exceeding asking, and the median price rose 10% to $2.8 million. Inventory has surged to 2.9 months, more than double last year's level, as sales volume fell 42% and pending sales declined 40%. Homes still spend just 16 days on market despite the softer activity.
Foster City home prices
Strong seller's market. Seller conditions 8/10, buyer conditions 3/10.
- Homes sold: 49 (Aug 2026 to Oct 2026)
- Median sale price: $1,522,941
- Median price per square foot: $914
- Median days on market: 22
- Average sale price to list price: 102.3%
- Sold above asking: 58%
- Months of supply: 1.6
- Price per square foot, average yearly change over 5 years (2021 to 2026): -0.4%
- Price per square foot, average yearly change over 10 years (2016 to 2026): 2.4%
Foster City is a strong seller's market right now. Homes are flying off the market, with a typical listing going under contract in just 22 days and nearly 58 percent selling above asking price. The market remains tight, with only 1.6 months of supply available and inventory down 26 percent from a year ago. Median prices have dipped 8.8 percent annually, though they've recovered 6.7 percent over the past three months.
Half Moon Bay home prices
Balanced market. Seller conditions 5/10, buyer conditions 6/10.
- Homes sold: 29 (Aug 2026 to Oct 2026)
- Median sale price: $1,722,802
- Median price per square foot: $857
- Median days on market: 28
- Average sale price to list price: 97.6%
- Sold above asking: 14%
- Months of supply: 3.8
- Price per square foot, average yearly change over 5 years (2021 to 2026): 1.7%
- Price per square foot, average yearly change over 10 years (2016 to 2026): 4.1%
Half Moon Bay's market is balanced between buyer and seller interests. Two-thirds of homes sold below their asking price, and the median listing spent 28 days on the market before finding a buyer. Supply has ticked up meaningfully, with 3.8 months available compared to 3.3 months a year earlier. Prices have held relatively steady, up just 1.3 percent year over year despite stronger price-per-square-foot gains.
Highlands home prices
Strong seller's market. Seller conditions 9/10, buyer conditions 2/10. Few sales, so treat this as a rough read.
- Homes sold: 6 (Aug 2026 to Oct 2026)
- Median sale price: $3,172,793
- Median price per square foot: $1,521
- Median days on market: 6
- Average sale price to list price: 110.8%
- Sold above asking: 100%
- Months of supply: 1.6
- Price per square foot, average yearly change over 5 years (2021 to 2026): 3.7%
- Price per square foot, average yearly change over 10 years (2016 to 2026): 4.2%
Highlands is a strong seller's market, though with low confidence given its small transaction volume. Every home sold above asking price this quarter, and the median property went under contract in just six days. Inventory has grown considerably from prior year lows, though it remains tight at 1.6 months of supply. The median sale price has surged 24.1 percent year over year, reaching $3.17 million.
Hillsborough home prices
Strong seller's market. Seller conditions 9/10, buyer conditions 3/10.
- Homes sold: 35 (Aug 2026 to Oct 2026)
- Median sale price: $6,158,216
- Median price per square foot: $1,735
- Median days on market: 18
- Average sale price to list price: 103.6%
- Sold above asking: 53%
- Months of supply: 1.4
- Price per square foot, average yearly change over 5 years (2021 to 2026): 4.3%
- Price per square foot, average yearly change over 10 years (2016 to 2026): 4.7%
Hillsborough presents a strong seller's market with tight conditions favoring those listing homes. The typical property lands a contract within 18 days and sells for 103.6 percent of list price, with 53 percent exceeding their asking price. Inventory has contracted to just 1.4 months of supply, down 16 percent annually. While the median sale price slipped 7.6 percent year over year to $6.16 million, homes have appreciated 11.3 percent by value according to broader measures.
La Honda home prices
Balanced market. Seller conditions 6/10, buyer conditions 6/10. Few sales, so treat this as a rough read.
- Homes sold: 5 (Aug 2026 to Oct 2026)
- Median sale price: $679,527
- Median price per square foot: $680
- Median days on market: 12
- Average sale price to list price: 99.8%
- Sold above asking: 40%
- Months of supply: 2.6
- Price per square foot, average yearly change over 5 years (2021 to 2026): -0.5%
- Price per square foot, average yearly change over 10 years (2016 to 2026): 2.1%
La Honda shows balanced market dynamics with modest shifts in buyer and seller advantage. The typical home closes in 12 days with 49.5 percent going under contract within two weeks, up sharply from a year earlier. Available supply has expanded to 2.6 months, though homes remain in short supply relative to historical patterns. The median price retreated 6.8 percent to $679,527, though per-square-foot metrics have strengthened with a 21.5 percent annual gain.
Menlo Park home prices
Strong seller's market. Seller conditions 9/10, buyer conditions 2/10.
- Homes sold: 84 (Aug 2026 to Oct 2026)
- Median sale price: $2,803,050
- Median price per square foot: $1,430
- Median days on market: 15
- Average sale price to list price: 102.7%
- Sold above asking: 54%
- Months of supply: 1.3
- Price per square foot, average yearly change over 5 years (2021 to 2026): 1.9%
- Price per square foot, average yearly change over 10 years (2016 to 2026): 3.6%
Menlo Park is operating as a strong seller's market with inventory constraints favoring those with homes on the market. Just 1.3 months of supply sits on the market, down from 1.6 months a year ago, and the typical home closes in 15 days. Homes are selling for 102.7 percent of list price, with 54 percent clearing their asking numbers. The median sale reached $2.80 million this quarter, up 4.8 percent annually.
Millbrae home prices
Strong seller's market. Seller conditions 10/10, buyer conditions 1/10.
- Homes sold: 41 (Aug 2026 to Oct 2026)
- Median sale price: $2,253,433
- Median price per square foot: $1,143
- Median days on market: 11
- Average sale price to list price: 111.8%
- Sold above asking: 75%
- Months of supply: 1.4
- Price per square foot, average yearly change over 5 years (2021 to 2026): 1.0%
- Price per square foot, average yearly change over 10 years (2016 to 2026): 2.8%
Millbrae is a strong seller's market with notably tight conditions. Homes are commanding 111.8 percent of list price on average, with three-quarters selling above asking. The median property closes in just 11 days, and 71.5 percent go under contract within two weeks. Despite these seller advantages, inventory has tightened further at 1.4 months of supply. The median sale price has jumped 25.2 percent year over year to $2.25 million.
Montara home prices
Buyer's market. Seller conditions 5/10, buyer conditions 7/10. Few sales, so treat this as a rough read.
- Homes sold: 7 (Aug 2026 to Oct 2026)
- Median sale price: $1,538,930
- Median price per square foot: $648
- Median days on market: 59
- Average sale price to list price: 97.5%
- Sold above asking: 14%
- Months of supply: 1.4
- Price per square foot, average yearly change over 5 years (2021 to 2026): 0.0%
- Price per square foot, average yearly change over 10 years (2016 to 2026): 3.8%
Montara is a buyer's market where purchasers have more leverage in negotiations. Nearly 71 percent of homes sold below asking price, and the typical listing requires 59 days on market before closing. Homes are selling for 97.5 percent of list price as a result. Supply has expanded to 1.4 months from 1.0 month a year earlier, giving buyers more selection. The median price has stayed relatively flat at $1.54 million, though per-square-foot values have declined.
Moss Beach home prices
Buyer's market. Seller conditions 4/10, buyer conditions 7/10. Few sales, so treat this as a rough read.
- Homes sold: 9 (Aug 2026 to Oct 2026)
- Median sale price: $1,254,128
- Median price per square foot: $849
- Median days on market: 70
- Average sale price to list price: 98.1%
- Sold above asking: 11%
- Months of supply: 2.5
- Price per square foot, average yearly change over 5 years (2021 to 2026): 0.5%
- Price per square foot, average yearly change over 10 years (2016 to 2026): 4.7%
Moss Beach is a buyer's market right now. Prices have fallen sharply, down 10.1% year-over-year, and two-thirds of homes sold below their list price. Homes are lingering longer too, spending 70 days on market compared to 41 days a year ago. Supply remains tight at 2.5 months, which keeps some floor under conditions, but the slowdown in sales activity is clear.
North Fair Oaks home prices
Balanced market. Seller conditions 6/10, buyer conditions 6/10.
- Homes sold: 23 (Aug 2026 to Oct 2026)
- Median sale price: $1,391,532
- Median price per square foot: $1,104
- Median days on market: 22
- Average sale price to list price: 101.4%
- Sold above asking: 41%
- Months of supply: 3.2
- Price per square foot, average yearly change over 5 years (2021 to 2026): 1.9%
- Price per square foot, average yearly change over 10 years (2016 to 2026): 3.7%
North Fair Oaks is a balanced market with significant shifts from a year ago. The median price has dropped 24.8%, while inventory has more than doubled and homes are moving faster at just 22 days on market. Roughly half the homes sold below asking, though nearly 41% still sold above. The uptick in new listings combined with faster sales suggests the market is finding equilibrium after a steeper correction.
Pacifica home prices
Strong seller's market. Seller conditions 8/10, buyer conditions 3/10.
- Homes sold: 83 (Aug 2026 to Oct 2026)
- Median sale price: $1,299,096
- Median price per square foot: $897
- Median days on market: 18
- Average sale price to list price: 102.9%
- Sold above asking: 61%
- Months of supply: 2.2
- Price per square foot, average yearly change over 5 years (2021 to 2026): -0.2%
- Price per square foot, average yearly change over 10 years (2016 to 2026): 3.6%
Pacifica is a strong seller's market. Homes are selling fast at 18 days on market, and over 60% sold above their asking price, fetching 102.9% on average. Inventory remains limited at 2.2 months of supply despite picking up slightly from earlier this year. The median price has nudged up 3.9% year-over-year, and more homes sold overall, pointing to robust buyer demand.
Portola Valley home prices
Strong seller's market. Seller conditions 9/10, buyer conditions 2/10.
- Homes sold: 12 (Aug 2026 to Oct 2026)
- Median sale price: $7,120,047
- Median price per square foot: $1,723
- Median days on market: 12
- Average sale price to list price: 100.9%
- Sold above asking: 58%
- Months of supply: 1.1
- Price per square foot, average yearly change over 5 years (2021 to 2026): 3.1%
- Price per square foot, average yearly change over 10 years (2016 to 2026): 3.7%
Portola Valley is a strong seller's market with extreme scarcity. The median price jumped 45.2% year-over-year despite fewer homes selling. Only 1.1 months of supply exists, with inventory down two-thirds from last year. Homes are moving very quickly at 12 days on market, and 58% sold above asking, underscoring just how limited the available stock is relative to buyer interest.
Redwood City home prices
Strong seller's market. Seller conditions 9/10, buyer conditions 2/10.
- Homes sold: 155 (Aug 2026 to Oct 2026)
- Median sale price: $1,848,714
- Median price per square foot: $1,159
- Median days on market: 14
- Average sale price to list price: 105.0%
- Sold above asking: 58%
- Months of supply: 1.6
- Price per square foot, average yearly change over 5 years (2021 to 2026): 2.5%
- Price per square foot, average yearly change over 10 years (2016 to 2026): 3.7%
Redwood City is a strong seller's market defined by tight inventory and fast sales. With 1.6 months of supply, homes average just 14 days on market, and 58% sell above asking for a 105% sale-to-list ratio. More homes sold year-over-year despite slightly lower median prices, while the surge in new listings and pending sales shows active competition among buyers.
San Bruno home prices
Strong seller's market. Seller conditions 9/10, buyer conditions 2/10.
- Homes sold: 73 (Aug 2026 to Oct 2026)
- Median sale price: $1,319,082
- Median price per square foot: $892
- Median days on market: 13
- Average sale price to list price: 105.4%
- Sold above asking: 61%
- Months of supply: 1.5
- Price per square foot, average yearly change over 5 years (2021 to 2026): 1.4%
- Price per square foot, average yearly change over 10 years (2016 to 2026): 3.3%
San Bruno is a strong seller's market with brisk activity. Homes spend just 13 days on market, 61% sold above asking, and the average sale-to-list ratio hit 105.4%. Supply sits at 1.5 months, and 60% of homes went under contract within two weeks. Fewer homes sold compared to a year ago, but pending sales remain active, indicating steady underlying demand.
San Carlos home prices
Strong seller's market. Seller conditions 9/10, buyer conditions 2/10.
- Homes sold: 81 (Aug 2026 to Oct 2026)
- Median sale price: $2,455,792
- Median price per square foot: $1,412
- Median days on market: 10
- Average sale price to list price: 107.0%
- Sold above asking: 60%
- Months of supply: 1.5
- Price per square foot, average yearly change over 5 years (2021 to 2026): 3.1%
- Price per square foot, average yearly change over 10 years (2016 to 2026): 4.2%
San Carlos is a strong seller's market despite fewer sales. Homes are flying off the market in 10 days, with 60% selling above asking and prices running 107% of list. While inventory grew 28% from last year, it remains tight at 1.5 months of supply. The median price climbed 15.6% year-over-year, and pending sales dropped steeply, suggesting the market shifted sharply in favor of sellers.
San Mateo home prices
Strong seller's market. Seller conditions 9/10, buyer conditions 3/10.
- Homes sold: 189 (Aug 2026 to Oct 2026)
- Median sale price: $1,625,369
- Median price per square foot: $1,027
- Median days on market: 14
- Average sale price to list price: 104.8%
- Sold above asking: 55%
- Months of supply: 1.8
- Price per square foot, average yearly change over 5 years (2021 to 2026): 1.6%
- Price per square foot, average yearly change over 10 years (2016 to 2026): 3.3%
San Mateo is a strong seller's market, though sales volume has cooled noticeably. Homes sell at 104.8% of asking and spend just 14 days on market, with 53% under contract within two weeks. The median price dipped 3% year-over-year, and pending sales fell 24.6%. Even so, 1.8 months of supply keeps conditions tight, and 55% of homes sold above listing price.
South San Francisco home prices
Strong seller's market. Seller conditions 9/10, buyer conditions 3/10.
- Homes sold: 78 (Aug 2026 to Oct 2026)
- Median sale price: $1,278,111
- Median price per square foot: $857
- Median days on market: 14
- Average sale price to list price: 109.4%
- Sold above asking: 79%
- Months of supply: 1.6
- Price per square foot, average yearly change over 5 years (2021 to 2026): 0.8%
- Price per square foot, average yearly change over 10 years (2016 to 2026): 3.7%
South San Francisco is a strong seller's market right now. Prices climbed 12.6% year over year, and nearly 80 percent of homes sold above asking price, fetching an average of 109.4 percent of list. The median home spent just 14 days on the market before going under contract, with almost half selling within two weeks. Inventory has grown by more than half compared to last year, though at 1.6 months of supply, homes still move faster than they list.
West Menlo Park home prices
Strong seller's market. Seller conditions 8/10, buyer conditions 3/10.
- Homes sold: 16 (Aug 2026 to Oct 2026)
- Median sale price: $3,747,393
- Median price per square foot: $1,764
- Median days on market: 13
- Average sale price to list price: 99.0%
- Sold above asking: 31%
- Months of supply: 1.0
- Price per square foot, average yearly change over 5 years (2021 to 2026): 2.9%
- Price per square foot, average yearly change over 10 years (2016 to 2026): 4.1%
West Menlo Park is a strong seller's market, though with moderate confidence given the small sample size. The typical home sold in 13 days, and 61 percent went under contract within two weeks, well above the year-ago pace. Prices rose nearly 12 percent year over year despite fewer pending sales overall, while available inventory shrank from a year earlier. Homes sold very close to asking price on average, with roughly equal shares landing above and below list.
Woodside home prices
Seller's market. Seller conditions 7/10, buyer conditions 5/10.
- Homes sold: 18 (Aug 2026 to Oct 2026)
- Median sale price: $4,094,652
- Median price per square foot: $1,452
- Median days on market: 27
- Average sale price to list price: 100.8%
- Sold above asking: 44%
- Months of supply: 3.6
- Price per square foot, average yearly change over 5 years (2021 to 2026): 2.9%
- Price per square foot, average yearly change over 10 years (2016 to 2026): 4.4%
Woodside is a seller's market with more balance than many Bay Area communities. Prices jumped 17 percent year over year, and homes sold for about 101 percent of asking on average, with 44 percent landing above list. The median home spent 27 days on the market, more than double the fastest-moving cities nearby, and months of supply edged up to 3.6. Despite stronger buyer interest year over year, homes for sale have grown by roughly a third, keeping some inventory in buyers' hands.
San Mateo County real estate trends
The charts below track the San Mateo County market month by month. Each one shows a different side of supply and demand, and together they show whether conditions are tightening or loosening.
San Mateo County median home sale price
The median sale price is the midpoint of every home that closed: half sold for more and half for less. It gives a better picture of a typical sale than the average, which one large estate sale can pull up. Over the last 3 months, the San Mateo County median was $1,721,395, up 5.6% from a year earlier. A median also moves with the mix of homes that happen to sell, so a stretch with more smaller homes can pull it down even when values haven't changed.

San Mateo County home prices per square foot
Price per square foot adjusts for size, so it's often a steadier read on value than the median price when the mix of large and small homes selling shifts from month to month. San Mateo County homes sold for a median of $1,043 per square foot over the last 3 months, up 3.5% from a year earlier. Over the last 10 years that works out to about 3.7% a year.

San Mateo County sale price vs list price
Sale-to-list compares what a home sold for with its final asking price. Above 100% means buyers typically paid more than asking, which happens when several buyers compete for the same home, and below 100% means sellers were giving some ground. San Mateo County homes averaged 105.0% of list price over the last 3 months, up 2.5 points from a year earlier.

Share of San Mateo County homes selling over asking
This is the share of sales that closed above the asking price. It tends to move early when demand heats up or cools off, often before prices themselves change. Over the last 3 months, 58% of San Mateo County sales went over asking, up 8.2 points from a year earlier.

San Mateo County new listings vs homes sold
When new listings run ahead of sales for a while, supply builds up and buyers get more to choose from. When sales keep pace with or outrun new listings, the shelf stays thin. Over the last 3 months, San Mateo County had 1,638 new listings and 1,352 homes sold.

San Mateo County homes for sale vs pending sales
Homes for sale is the inventory on the market, and pending sales are homes that went under contract. A pending line climbing against flat or falling inventory means buyers are absorbing what gets listed. San Mateo County averaged about 753 homes for sale over the last 3 months, down 6.0% from a year earlier.

San Mateo County months of supply
Months of supply estimates how long the homes on the market would last at the recent pace of sales if nothing new were listed. Around 2 months or less usually goes with competitive conditions, while 5 to 6 months or more tends to give buyers more room to negotiate. San Mateo County averaged 1.7 months over the last 3 months, about the same as a year earlier.

San Mateo County days on market
Median days on market counts how long the typical home took to go under contract. It usually rises late in the year and drops in spring, so it's fairer to compare it with the same months a year earlier than with the month before. The San Mateo County median was 14 days over the last 3 months, 5 days shorter than a year earlier.

When San Mateo County homes sell during the year
This chart averages home sales by calendar month across several years, with 100 standing for a typical month. Sales follow the calendar more than prices do, so a slow winter month isn't by itself a sign the market has turned. June has historically been the busiest month for San Mateo County sales, running about 21% above an average month, and January the quietest, about 41% below.

Home values and rents
As of October 2026, Zillow puts the typical home value in San Mateo County at $1,579,058 (+0.5% vs a year earlier). Typical rent is $3,993 a month and 17.5% of listings have had a price cut. The typical home value covers every home in the area, not just the ones that sold, so it won't match the median sale price above.
San Mateo County typical home value
The typical home value is an index of the middle of the market across every home in the area, sold or not, so it moves more smoothly than sale prices and shows the longer trend.

San Mateo County typical rent
Typical rent tracks asking rents for homes and apartments across the area. Set against the typical home value, it shows how the cost of renting compares with the cost of owning.

San Mateo County real estate market forecast
The data indicate a reasonable projected change of +4.3% in San Mateo County home values over the next 12 months, to about $1.65 million by September 2027, with a likely range of -6.2% to +13.4%.
| Horizon | Month | Projected change | Typical value | Likely range |
|---|---|---|---|---|
| 3 months | December 2026 | +0.6% | $1.59 million | -2.1% to +2.7% |
| 6 months | March 2027 | +1.9% | $1.61 million | -3.9% to +6.4% |
| 9 months | June 2027 | +3.3% | $1.63 million | -5.0% to +10.4% |
| 12 months | September 2027 | +4.3% | $1.65 million | -6.2% to +13.4% |

The starting point is San Mateo County's typical home value of $1.58 million in September 2026, from the Zillow Home Value Index, which covers every home in the area, not only the ones that sold.
Values are projected to keep climbing through the year: +0.6% by December, +1.9% by March, +3.3% by June and +4.3% by September. That is below the roughly 6.5% a typical year has brought California home values since 2010, the history the model learned from. Zillow's forecast for the ZIP codes in San Mateo County (published October 2026) calls for +1.6% over 12 months, while my market model on its own says +5.3%. My model is the more upbeat of the two. The projection blends them, leaning on Zillow most in the near term and on my model (about 75% of the weight) at 12 months.
What's moving the forecast
- Home values fell 0.1% in the latest month, which takes about 0.8 points off the 12-month outlook.
- Home values are up 0.5% over the past year, slower than the usual pace, which takes about 0.6 points off the 12-month outlook.
- There are 13.6% fewer homes for sale than a year ago, which adds about 0.5 points to the 12-month outlook.
How accurate is this forecast? I backtested my model month by month since January 2017: at each step it was trained only on data available at the time, then checked against what actually happened across Bay Area counties. Its 12-month projections missed by 5.5 points on average, against 6.3 points for simply assuming prices stay flat, and it called the direction right 65% of the time. At 3 months the average miss was 1.3 points. The likely range is deliberately cautious: it's sized from past misses that include the 2022 rate shock, and in a test on 2024 to 2026 outcomes nearly all of them landed inside it.
A projection is an estimate of where area-wide typical home values are heading, not a promise, and not a valuation or appraisal of any home. It describes where the numbers point, not when anyone should buy or sell. Forecast sources: Zillow Home Value Index and Home Value Forecast (Zillow Research); Redfin Data Center, a national real estate brokerage; Freddie Mac 30-year fixed mortgage rate, via FRED (Federal Reserve Bank of St. Louis).

Prop 19 Calculator
Can You Take Your Low Property Tax With You?
If you're 55 or older, Prop 19 may let you carry your current tax base to a new home anywhere in California. Plug in your numbers and see what your property taxes could look like after you move.
Estimate My Property Taxes →San Mateo County home prices: frequently asked questions
What is the average home price in San Mateo County?
Over the last 3 months through October 2026, the median sale price in San Mateo County was $1,721,395, up 5.6% from a year earlier. Across the last 12 months (Nov 2025 to Oct 2026) the median was $1,687,764. The median is the midpoint of every home that sold, which describes a typical sale better than an average, since one large sale can pull an average well above what most homes go for. Zillow's typical home value, which covers every home in the area and not only the ones that sold, was $1,579,058 as of October 2026.
How many homes sold in San Mateo County in the last 12 months?
5,281 homes sold in San Mateo County over the 12 months from Nov 2025 to Oct 2026, compared with 5,072 in the 12 months before that. Over the last 3 months through October 2026, 1,352 homes sold.
How much do you need to make to afford a house in San Mateo County?
At the San Mateo County median sale price of $1,721,395, a buyer putting 20% down ($344,000) would borrow about $1,377,000. At the national average 30-year fixed rate of 7.25% (Freddie Mac, week of November 19, 2026), principal and interest come to about $9,390 a month, and property taxes and homeowners insurance add roughly $2,150, for about $11,550 a month in all. Lenders commonly look for housing costs of no more than about 28% of gross income, which puts the household income needed at around $495,000 a year. Treat that as a rough guide: the actual tax rate, insurance, HOA dues, other debts, the size of the down payment and the rate a lender offers all move the number.
Is San Mateo County a buyer's or seller's market right now?
Strong seller's market, based on home sales over the last 3 months through October 2026. Seller conditions rate 9 out of 10 and buyer conditions 2 out of 10, judged against the same months a year earlier. About 1.7 months of supply. Under 3 months usually means more buyers than homes for sale.
How fast are homes selling in San Mateo County?
The typical San Mateo County home went under contract in 14 days over the last 3 months, 5 days shorter than a year earlier. Homes sold for an average of 105.0% of their list price, and 58% sold above asking.
Are home prices going up or down in San Mateo County?
San Mateo County homes sold for a median of $1,043 per square foot over the last 3 months, up 3.5% from a year earlier. Over the longer run, price per square foot changed by about 1.4% a year over 5 years and 3.7% a year over 10 years. Short swings in a small market often reflect which homes happened to sell, so the longer trend is the steadier read.
What does it cost to rent in San Mateo County?
Zillow's typical rent for San Mateo County was $3,993 a month as of October 2026, up 11.8% from a year earlier.
What is the San Mateo County real estate market forecast for 2027?
The data indicate a reasonable projected change of +4.3% in San Mateo County home values over the next 12 months, to about $1.65 million by September 2027, with a likely range of -6.2% to +13.4%. The projection blends Zillow's Home Value Forecast with my own market model, which reads recent price momentum, supply and demand, and mortgage rates. A projection is an estimate of where area-wide typical home values are heading, not a promise, and not a valuation or appraisal of any home. It describes where the numbers point, not when anyone should buy or sell.
Sources: Redfin, a national real estate brokerage, and Zillow Research. Data through October 2026; updated November 20, 2026. Each chart point covers one calendar month, not seasonally adjusted. Area-wide market conditions only, not an appraisal or valuation of any home.
What Moves San Mateo County Home Prices
San Mateo County is twenty cities and towns plus unincorporated areas like North Fair Oaks, Emerald Hills and the Midcoast, and a single countywide median hides a lot of range. Atherton, Hillsborough, Woodside and Portola Valley sit at the very top of the market, Menlo Park, Burlingame, San Carlos and Belmont aren't far behind, and San Mateo, Redwood City and Foster City cover a wide middle. The north county cities of Daly City, South San Francisco, San Bruno and Pacifica have more moderate prices, and the coastside around Half Moon Bay is a market of its own. The city-by-city breakdown above shows how each of those markets is doing right now.
School boundaries are one of the biggest price drivers here, and they don't always follow city lines. Small elementary districts like Hillsborough, Las Lomitas and Menlo Park City carry a real premium, and most of the county's high schoolers go to schools in the Sequoia Union or San Mateo Union high school districts. Families pay close attention to those assignments, so it's worth knowing exactly which schools your home feeds before you set a price.
The hills and the coast are where pricing gets complicated. In Woodside, Portola Valley, Emerald Hills and along Skyline, many properties are on wells and septic systems, sit on private roads with shared maintenance agreements, and fall within mapped fire hazard zones where insurance has become harder and more expensive to get. On the coast, bluff erosion and Coastal Commission rules can show up in a buyer's due diligence. Appraisers often have very few true comparable sales for those homes, while in the flatlands the questions are more about condition, permits on older additions, and how a home compares with what's selling a few streets over.
Condition and era matter more than most people expect. Much of the county was built out in the decades after World War II, from the Doelger homes of Daly City's Westlake to the Eichlers in the San Mateo Highlands and the ranch homes that fill San Carlos, Belmont and Redwood City, and plenty of them are still owned by the families who bought them new. Buyers here fall into two camps: the ones who want to move in and the ones who plan to take it down to the studs or start over. The right pricing and preparation strategy depends on which camp your home is going to attract, and that's a conversation worth having before you spend a dollar on updates. Sometimes the answer is selling as-is to an investor or a builder, and sometimes a targeted refresh through Compass Concierge adds far more than it costs. I've seen both play out across the Peninsula, and you can read how a few of those sales went in my case studies.
Free Seller Strategy Session
Before we talk money, let's talk about you.
The biggest financial wins in a move happen long before a home hits the market, and they start with understanding your situation. In 30 minutes we'll talk through what's changing, who's involved, and what you need this move to do for you, then map out a plan that gets you there with a clear financial advantage.
Book My Strategy Session →
If You've Owned Your Home for Decades
Most of the people I work with in San Mateo County bought in the 70s, 80s or 90s, and for them the value question comes wrapped in a tax question. Your Prop 13 assessment might be a small fraction of what the home is worth today, which is wonderful while you own it and complicated the moment you start thinking about selling. The good news is that Prop 19 lets homeowners 55 and older carry that low tax base to a replacement home anywhere in California, up to three times, and the replacement can even cost more than what you sold for, with the difference added to your basis. That one rule changes the math on downsizing for a lot of families who assumed they were stuck, and I've put together a Prop 19 FAQ that covers the details.
Capital gains are the other half of it. The federal exclusion of $250,000 for an individual or $500,000 for a couple was generous in 1997 and doesn't stretch very far against a San Mateo County sale today, particularly for someone who bought decades ago. There are real strategies for managing that exposure, from documenting every improvement you've made over the years to timing and structure decisions, and the worst outcome is finding out about the tax bill after the sale closes. IRS Publication 523 lays out the rules, and my home sale calculator will give you a rough sense of what you'd net. If you want to think it through before you decide anything, that's exactly the conversation I have with longtime homeowners every week.
Permits are worth checking early too. In San Mateo County, permits, ADU rules and code questions go through whichever city or town your home is in, or through the County's planning and building department if you're in an unincorporated area like North Fair Oaks, Emerald Hills, Ladera or the Midcoast, where the coastal zone adds another layer of review. When a buyer's inspector finds a converted garage, an addition or a second unit that was never permitted, that agency's process and timelines are what you'd be dealing with. Knowing that ahead of time makes a big difference in how the negotiation goes, and it's one of the first things I look at when I walk a property.
Get Your San Mateo County Home Value
An online estimate is a good starting point, and the live data above tells you which way your part of the county is leaning. What neither one can do is walk your property, look at the permit history, look at what your particular city and neighborhood have been doing this year, and tell you whether your home is a move-in sale or an investor sale. If you'd like that, I'll put together a proper valuation of your home's fair market value with no obligation and no pressure to list. Book a call and we'll talk it through.