
Silicon Valley vs. Bay Area home prices: November 2026 update
Data through October 2026. Updated November 20, 2026.
Every figure in this report covers single-family homes only. Condos, townhouses and buildings with 2 to 4 units are left out, so the prices, sales counts and supply here won't match figures that mix every type of home.
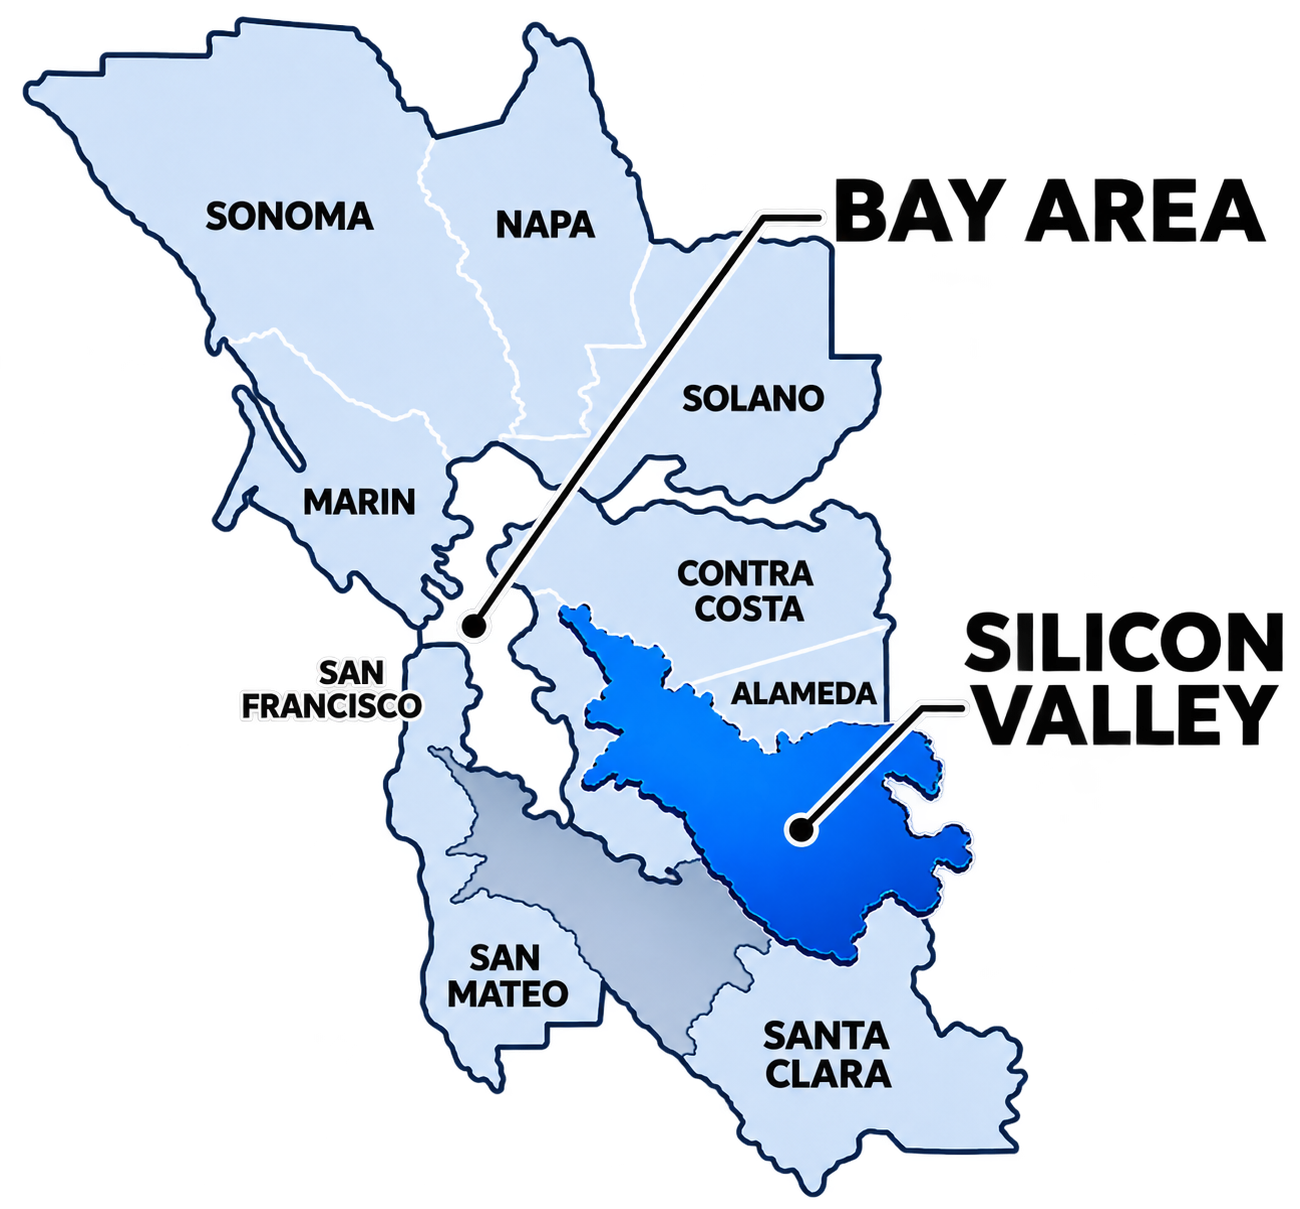
This report compares Silicon Valley with the rest of the Bay Area. Silicon Valley means the central, urbanized cities in San Mateo and Santa Clara counties: the "South Bay" and the Peninsula up to San Francisco Airport. The rest of the Bay Area is everything else in the nine counties that touch San Francisco Bay (Alameda, Contra Costa, Marin, Napa, San Francisco, Solano and Sonoma counties, plus Gilroy, Morgan Hill and San Martin, and San Mateo County's north end and coast). Together they make up the whole Bay Area, and no home is counted twice.
Silicon Valley: Strong seller's market. Seller conditions rate 9 out of 10 and buyer conditions 3 out of 10, based on single-family home sales over the last 3 months through October 2026 compared with a year earlier.
Rest of the Bay Area: Strong seller's market. Seller conditions rate 8 out of 10 and buyer conditions 3 out of 10, based on single-family home sales over the last 3 months through October 2026 compared with a year earlier.
What's my Bay Area home worth?
Whether you're in Silicon Valley or elsewhere around the Bay, see what your home is really worth with multiple valuations side by side, each with a confidence score so you know which number to trust.
Silicon Valley vs. Bay Area Market Brief
Key Takeaways
As of November 20, 2026, Silicon Valley is in a strong seller's market, as is the rest of the Bay Area, though Silicon Valley leans even more heavily toward sellers. The headline figure: Silicon Valley's median sale price of $2.52 million sits 126% above the rest of the Bay Area's $1.12 million. Both areas gained roughly 4% year over year, suggesting the gap is holding steady in percentage terms, though it represents hundreds of thousands of dollars in absolute terms.
The two markets are behaving quite differently despite carrying the same overall rating. Silicon Valley homes sell far faster: a median 15 days on market versus 26 days elsewhere, with 54% of Silicon Valley homes under contract within two weeks compared to just 39% in the rest of the Bay Area. Silicon Valley's supply is tighter at 1.5 months versus 2.4 months, though interestingly Silicon Valley added inventory over the year while the rest of the Bay Area lost it. Bidding dynamics also diverge: 60% of Silicon Valley homes sold above asking, up slightly, while 52% did so in the rest of the Bay Area, a bigger jump suggesting more competition there.
Over the past twelve months, Silicon Valley sales fell 4.1% while the rest of the Bay Area dropped 5.2%, a smaller decline. The longer-run picture shows a widening gap. Silicon Valley's median price per square foot has climbed an average 5.8% yearly over the past decade, about 1.4 times the rest of the Bay Area's 4.1% pace. The typical home value, which smooths month-to-month swings, rose 3.2% in Silicon Valley and 3.3% in the rest of the Bay Area, tracking closely with the sales data.
Silicon Valley vs. the rest of the Bay Area: key metrics
Single-family homes over the last 3 months, through October 2026. The last column compares Silicon Valley with the rest of the Bay Area.
| Measure | Silicon Valley | Rest of the Bay Area | Silicon Valley vs. the rest |
|---|---|---|---|
| Median sale price | $2,523,102 | $1,116,602 | 126% higher |
| Typical home value | $2,276,231 | $1,075,070 | 112% higher |
| Median price per sq ft | $1,318 | $652 | 102% higher |
| Median days on market | 15 days | 26 days | 12 days faster |
| Under contract within 2 weeks | 54% | 39% | +14.3 pts |
| Average sale-to-list | 104.4% | 105.5% | -1.1 pts |
| Sold above list price | 60% | 52% | +7.9 pts |
| Months of supply | 1.5 | 2.4 | 0.8 fewer months |
| Homes for sale (average) | 1,340 | 6,078 | 18% of the Bay Area |
| Homes sold | 2,610 | 7,643 | 25% of the Bay Area |
| New listings | 3,160 | 9,185 | 26% of the Bay Area |
| Listings with a price cut | 19.3% | 21.5% | -2.2 pts |
| Yearly change in $/sq ft, 5 years | +3.9% | +1.3% | +2.6 pts |
| Yearly change in $/sq ft, 10 years | +5.8% | +4.1% | +1.7 pts |
How Silicon Valley and the rest of the Bay Area changed from a year earlier
Each figure compares the last 3 months with the same 3 months a year earlier, which takes out the seasonal swings.
| Measure | Silicon Valley | Rest of the Bay Area |
|---|---|---|
| Median sale price | +4.0% | +4.3% |
| Typical home value | +3.2% | +3.3% |
| Median price per sq ft | +5.1% | +4.8% |
| Median days on market | -1 days | -5 days |
| Under contract within 2 weeks | -0.9 pts | +3.3 pts |
| Average sale-to-list | +0.8 pts | +2.8 pts |
| Sold above list price | +1.0 pts | +5.6 pts |
| Months of supply | +0.5 months | -0.0 months |
| Homes for sale (average) | +38.3% | -6.7% |
| Homes sold | -4.1% | -5.2% |
| New listings | +10.3% | -2.0% |
Median sale price: Silicon Valley vs. the rest of the Bay Area
Silicon Valley's median sale price of $2,523,102 runs 126% higher than the rest of the Bay Area's $1,116,602, with Silicon Valley's typical home value at $2,276,231 and the rest of the Bay Area's at $1,075,070. Both regions posted similar year-over-year gains: Silicon Valley rose 4.0% and the rest of the Bay Area 4.3%, meaning the absolute dollar gap widened even as the percentage gap held steady. Looking back further, Silicon Valley's median price has climbed about 73% from $1.49 million in late 2016 to today's $2.57 million, while the rest of the Bay Area's climbed from $782,310 to $1.12 million, nearly a 43% gain.

Typical home value: Silicon Valley vs. the rest of the Bay Area
The typical home value reflects all single-family homes in each region, not just those sold in a given quarter, making it a smoother gauge of underlying market value than the median sale price. Silicon Valley's typical home value stands at $2,276,231, 112% above the rest of the Bay Area's $1,075,070. Over the past year, both regions gained nearly identical ground: Silicon Valley's index rose 3.2% and the rest of the Bay Area's 3.3%, suggesting that the market value gap between the two has held steady even as individual sales prices bounce around. This stability reflects how the index tracks the broader stock of homes rather than the mix of properties that happen to sell in any single window.

Price per square foot: Silicon Valley vs. the rest of the Bay Area
Silicon Valley commands $1,318 per square foot compared to $652 in the rest of the Bay Area, a gap of 102%. Year over year, Silicon Valley gained 5.1% per square foot and the rest of the Bay Area 4.8%, another tight race. Over five years, Silicon Valley's median price per square foot climbed 3.9% yearly on average, versus 1.3% for the rest of the Bay Area, a noticeable divergence. The ten-year view shows the gap widening further: Silicon Valley's median price per square foot has risen 5.8% per year on average versus 4.1% in the rest of the Bay Area, underscoring a persistent trend of Silicon Valley moving faster.

How fast homes sell in Silicon Valley vs. the rest of the Bay Area
Silicon Valley homes move much faster: a median 15 days on market versus 26 days in the rest of the Bay Area, putting Silicon Valley 12 days ahead. This gap persists despite the rest of the Bay Area actually improving faster year over year (down 5 days versus Silicon Valley's 1-day decline). The share under contract within two weeks tells a sharper story: 54% of Silicon Valley homes reach that milestone compared to 39% in the rest of the Bay Area, a gap of 14 percentage points. Silicon Valley's tighter supply and faster sale pace create conditions favoring sellers, while the rest of the Bay Area's longer marketing window gives buyers more time to evaluate options.

Sale-to-list and bidding: Silicon Valley vs. the rest of the Bay Area
Silicon Valley's average sale-to-list ratio of 104.4% trails the rest of the Bay Area's 105.5%, meaning homes in the rest of the Bay Area typically sell slightly higher relative to their asking price. However, Silicon Valley saw a bigger share of homes sell above list price: 60% versus 52%, though that gap narrowed over the year as the rest of the Bay Area's above-ask share jumped 5.6 percentage points while Silicon Valley's rose just 1.0 point. Both metrics favor sellers, though the rest of the Bay Area's slightly higher sale-to-list and faster year-over-year improvement in above-ask sales suggest fractionally hotter bidding wars there despite Silicon Valley's tighter overall inventory.


Supply: Silicon Valley vs. the rest of the Bay Area
Silicon Valley's 1.5 months of supply is notably tight, 0.8 months below the rest of the Bay Area's 2.4 months. This tight inventory favors sellers in Silicon Valley, limiting buyers' options and supporting faster sales. What complicates the story is Silicon Valley's inventory direction: homes for sale grew 38.3% year over year to an average of 1,340, while the rest of the Bay Area's inventory shrank 6.7% to 6,078. New listings in Silicon Valley jumped 10.3%, outpacing the rest of the Bay Area's 2.0% decline. These diverging trends suggest Silicon Valley is adding supply even as it sells faster, while the rest of the Bay Area is not replenishing its stock as it moves inventory.


Sales and new listings: Silicon Valley vs. the rest of the Bay Area
Silicon Valley sold 2,610 homes over the three-month window, down 4.1% from a year earlier, while the rest of the Bay Area moved 7,643, a steeper 5.2% decline. Silicon Valley accounted for 25% of the Bay Area's sales despite holding just 18% of listed homes, indicating a faster sales pace. New listings paint a different picture: Silicon Valley contributed 26% of new listings to the Bay Area's total, outweighing its share of sales. The diverging volume trends, with Silicon Valley declining less sharply than the rest of the Bay Area, reflect supply tightness in Silicon Valley offsetting a slight softening in buyer demand.


Home prices by year: Silicon Valley vs. the rest of the Bay Area
The price gap between the two areas has held remarkably steady over the period shown. Over the most recent 12 months (November 2025 to October 2026), Silicon Valley's median was $2,572,644 versus $1,115,103 in the rest of the Bay Area, a gap of 131%, up slightly from 129% in the 12 months before that. Going back a decade to late 2016 and early 2017, Silicon Valley's median stood at $1,485,590 and the rest of the Bay Area's at $782,310, a gap of just 90%. The widening gap from 90% to 131% over ten years underscores Silicon Valley's persistent appreciation premium, though the most recent year shows that premium stabilizing.
| 12 months | Silicon Valley median | Rest of the Bay Area median | Silicon Valley premium | Silicon Valley $/sq ft | Rest of the Bay Area $/sq ft |
|---|---|---|---|---|---|
| Nov 2025 to Oct 2026 | $2,572,644 | $1,115,103 | +131% | $1,304 | $648 |
| Nov 2024 to Oct 2025 | $2,475,093 | $1,082,775 | +129% | $1,274 | $632 |
| Nov 2023 to Oct 2024 | $2,355,896 | $1,079,451 | +118% | $1,255 | $635 |
| Nov 2022 to Oct 2023 | $2,182,727 | $1,025,194 | +113% | $1,146 | $606 |
| Nov 2021 to Oct 2022 | $2,264,163 | $1,104,843 | +105% | $1,202 | $651 |
| Nov 2020 to Oct 2021 | $2,059,668 | $1,047,073 | +97% | $1,075 | $607 |
| Nov 2019 to Oct 2020 | $1,790,077 | $919,630 | +95% | $941 | $538 |
| Nov 2018 to Oct 2019 | $1,673,286 | $863,331 | +94% | $902 | $520 |
| Nov 2017 to Oct 2018 | $1,732,716 | $863,816 | +101% | $945 | $515 |
| Nov 2016 to Oct 2017 | $1,485,590 | $782,310 | +90% | $809 | $467 |
Forecast: Silicon Valley vs. the rest of the Bay Area
My model projects the typical single-family home value to change +3.4% over the next 12 months in Silicon Valley (likely range -8.2% to +13.4%) and +4.9% in the rest of the Bay Area (likely range -5.6% to +14.5%). The ranges are wide on purpose: they're sized from how far the model's past projections missed, and both areas are combined from smaller areas, which widens them further. Treat these as a read on direction, not a promise.
| Horizon | Silicon Valley | Rest of the Bay Area |
|---|---|---|
| 3 months | +1.3% (-1.7% to +3.7%) | +1.9% (-0.8% to +4.2%) |
| 6 months | +1.8% (-4.5% to +6.7%) | +3.1% (-2.7% to +7.8%) |
| 9 months | +2.4% (-6.6% to +10.0%) | +4.2% (-4.1% to +11.3%) |
| 12 months | +3.4% (-8.2% to +13.4%) | +4.9% (-5.6% to +14.5%) |
Projected change in the typical single-family home value from my market model, with its likely range. A projection, not a promise: actual results can fall outside the range. Forecast sources: Zillow Research, Redfin Data Center, and Freddie Mac mortgage rates via FRED.
Silicon Valley vs. Bay Area home prices: frequently asked questions
How do you define Silicon Valley?
I define Silicon Valley as the central, urbanized part of Santa Clara and San Mateo counties, where the tech employers are and where the people who work there actually live and commute: the South Bay and the Peninsula up to San Francisco Airport. In Santa Clara County that's Campbell, Cupertino, Los Altos, Los Altos Hills, Los Gatos, Milpitas, Monte Sereno, Mountain View, Palo Alto, San Jose, Santa Clara, Saratoga and Sunnyvale. In San Mateo County it's Atherton, Belmont, Burlingame, East Palo Alto, Foster City, Hillsborough, Menlo Park, Millbrae, Portola Valley, Redwood City, San Bruno, San Carlos, San Mateo and Woodside. The unincorporated neighborhoods in and around those cities count too. I leave out the south end of Santa Clara County (Gilroy, Morgan Hill and San Martin) and San Mateo County's north end and coast (Daly City, Colma, Brisbane, South San Francisco, Pacifica, Half Moon Bay and the coastside towns), because they behave like their own markets rather than part of the tech core.
How do you define the Bay Area?
The Bay Area here means the nine counties that touch San Francisco Bay, the standard regional definition: Alameda, Contra Costa, Marin, Napa, San Francisco, San Mateo, Santa Clara, Solano and Sonoma. Santa Cruz and Monterey counties aren't part of it, even though plenty of people commute over the hill. Silicon Valley sits inside the Bay Area, so whenever I compare the two I take Silicon Valley's sales out and set it against the rest of the Bay Area, which means no home is counted on both sides.
What does "the rest of the Bay Area" include?
Everything in those nine counties that isn't Silicon Valley: all of Alameda, Contra Costa, Marin, Napa, San Francisco, Solano and Sonoma counties, plus Gilroy, Morgan Hill and San Martin at the south end of Santa Clara County and San Mateo County's north end and coast. Silicon Valley and the rest of the Bay Area together make up the whole Bay Area, and no home is counted in both, so the comparison is a clean split.
Are homes more expensive in Silicon Valley than in the rest of the Bay Area?
Yes. Over the last 3 months the median single-family home sold for $2,523,102 in Silicon Valley and $1,116,602 in the rest of the Bay Area, a difference of 126%. The typical home value, which covers every house rather than only those that sold, is about $2,276,231 in Silicon Valley and $1,075,070 in the rest of the Bay Area.
How much more per square foot does a home cost in Silicon Valley?
The median price per square foot is $1,318 in Silicon Valley and $652 in the rest of the Bay Area, 102% higher in Silicon Valley. Price per square foot takes home size out of the comparison, which matters because homes in different parts of the Bay Area differ in size.
Do homes sell faster in Silicon Valley or the rest of the Bay Area?
The median single-family home sold in 15 days in Silicon Valley and 26 days in the rest of the Bay Area over the last 3 months, so homes sell faster in Silicon Valley.
Is Silicon Valley a seller's market compared with the rest of the Bay Area?
Silicon Valley rates as a strong seller's market (seller conditions 9 out of 10, buyer conditions 3 out of 10) and the rest of the Bay Area as a strong seller's market (8 and 3 out of 10). The ratings weigh supply, sale-to-list, how many homes sell above or below asking, days on market and price trends against a year earlier.
Do these prices include condos and townhouses?
No. Every figure covers single-family homes only. Condos, townhouses and buildings with 2 to 4 units are left out, so the prices, sales counts and supply here won't match figures that mix every type of home.
What is the home price forecast for Silicon Valley vs. the rest of the Bay Area?
My model projects the typical single-family home value to change +3.4% in Silicon Valley and +4.9% in the rest of the Bay Area over the next 12 months, with likely ranges of -8.2% to +13.4% and -5.6% to +14.5%. It's a projection, not a promise.
More home price reports
- Silicon Valley home prices
- Bay Area home prices
- Alameda County home prices
- San Mateo County home prices
- Santa Clara County home prices
Sources: Redfin, a national real estate brokerage, and Zillow Research. Data through October 2026; updated November 20, 2026. Single-family homes only: condos, townhouses and buildings with 2 to 4 units are left out. Each chart point covers the 3 months ending that month. Both areas combine smaller areas: counts are added up, and medians and averages are weighted by home sales. Area-wide market conditions only, not an appraisal or valuation of any home.
Why Silicon Valley and the Rest of the Bay Area Price So Differently
For this comparison, Silicon Valley means the central, urbanized cities of Santa Clara and San Mateo counties: the South Bay and the Peninsula up to San Francisco Airport. The rest of the Bay Area is everything else in the nine counties that touch the bay, which takes in San Francisco, the East Bay, Marin and the North Bay, plus Gilroy, Morgan Hill and San Martin and the north end and coast of San Mateo County. Put the two together and you have the whole Bay Area, with no home counted twice, so the comparison above is a clean one.
The gap between them comes down to jobs and commutes more than anything else. The biggest concentration of tech employers sits along the corridor from Palo Alto down through San Jose, and buyers pay a premium to live close to it. When hiring, stock compensation and return-to-office plans shift, Silicon Valley usually feels it first, and the rest of the Bay Area follows as buyers rethink how far they are willing to drive. That is why the two markets can move at different speeds in the same month, and why a Bay Area headline number can hide what is happening in your own corner of it.
Supply versus demand is the part I watch most closely, and it is where the two markets differ the most. Silicon Valley has very little land left to build on, so most of what comes up for sale is resale inventory from people who have owned for years, and a small change in the number of listings moves prices and bidding quickly. Parts of the rest of the Bay Area have more room to grow and more homes coming to market, which tends to give buyers a little more time and choice. The months of supply, days on market and sale-to-list figures above show which way each side is leaning right now, and my Santa Clara County, San Mateo County and Alameda County pages go a level deeper, city by city.
For a lot of the families I work with, this comparison is not academic. A longtime Silicon Valley homeowner thinking about moving closer to the kids in the East Bay or the North Bay is really asking how much of their equity a move would free up, and the price gap above is a big part of that answer. The reverse is true for buyers stretching to get closer to work. Either way, the numbers give you a starting point, and the details of your own home and timing do the rest.
Free Seller Strategy Session
Before we talk money, let's talk about you.
The biggest financial wins in a move happen long before a home hits the market, and they start with understanding your situation. In 30 minutes we'll talk through what's changing, who's involved, and what you need this move to do for you, then map out a plan that gets you there with a clear financial advantage.
Book My Strategy Session →
If You've Owned Your Home for Decades
Most of the people I work with bought in the 70s, 80s or 90s, and for them the value question comes wrapped in a tax question. Your Prop 13 assessment might be a small fraction of what the home is worth today, which is wonderful while you own it and complicated the moment you start thinking about selling. The good news is that Prop 19 lets homeowners 55 and older carry that low tax base to a replacement home anywhere in California, up to three times, and the replacement can even cost more than what you sold for, with the difference added to your basis. That one rule changes the math on downsizing for a lot of families who assumed they were stuck, and I've put together a Prop 19 FAQ that covers the details.
Capital gains are the other half of it. The federal exclusion of $250,000 for an individual or $500,000 for a couple was generous in 1997 and doesn't stretch very far against a Bay Area sale today, particularly for someone who bought decades ago. There are real strategies for managing that exposure, from documenting every improvement you've made over the years to timing and structure decisions, and the worst outcome is finding out about the tax bill after the sale closes. IRS Publication 523 lays out the rules, and my home sale calculator will give you a rough sense of what you'd net. If you want to think it through before you decide anything, that's exactly the conversation I have with longtime homeowners every week.
Permits are worth checking early too. Permits, ADU rules and code questions go through whichever city your home is in, or through the county if you're in an unincorporated area, and every one of the nine counties and dozens of cities does it a little differently. When a buyer's inspector finds a converted garage, an addition or a second unit that was never permitted, that agency's process and timelines are what you'd be dealing with. Knowing that ahead of time makes a big difference in how the negotiation goes, and it's one of the first things I look at when I walk a property.
Get Your Bay Area Home Value
An online estimate is a good starting point, and the live data above tells you which way your part of the Bay Area is leaning. What neither one can do is walk your property, look at the permit history, look at what your particular city and neighborhood have been doing this year, and tell you whether your home is a move-in sale or an investor sale. If your home is in Silicon Valley, Fremont, Santa Cruz or Monterey County, I'll put together a proper valuation of your home's fair market value with no obligation and no pressure to list. If you're elsewhere in the Bay Area, I'm happy to talk it through and connect you with an agent I trust in your area. Book a call and we'll go from there.