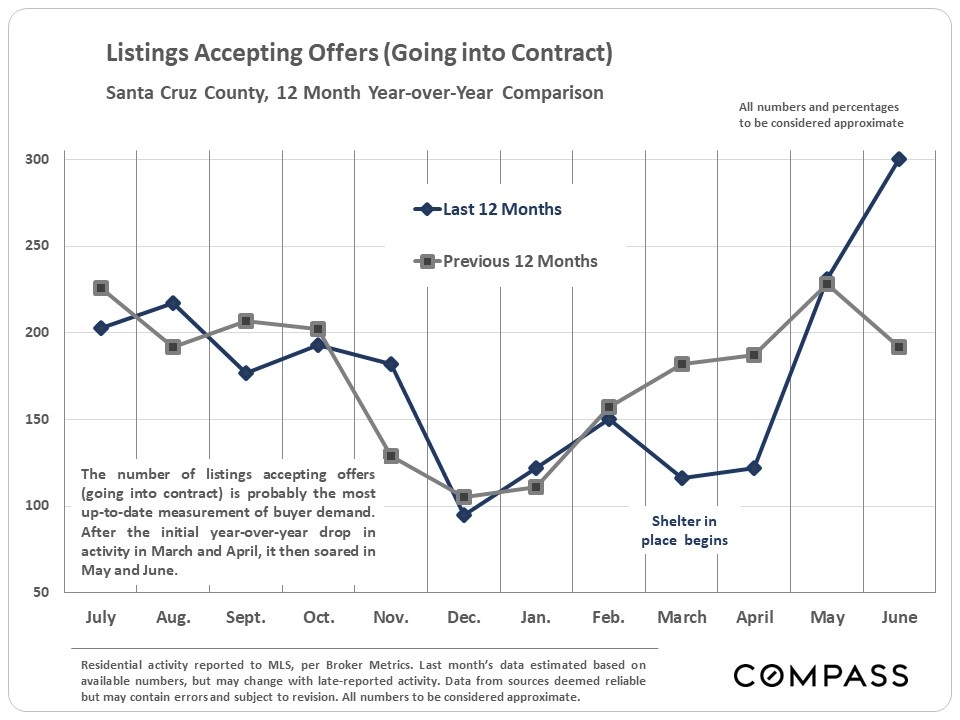
Market Activity Soars after Early Spring Decline
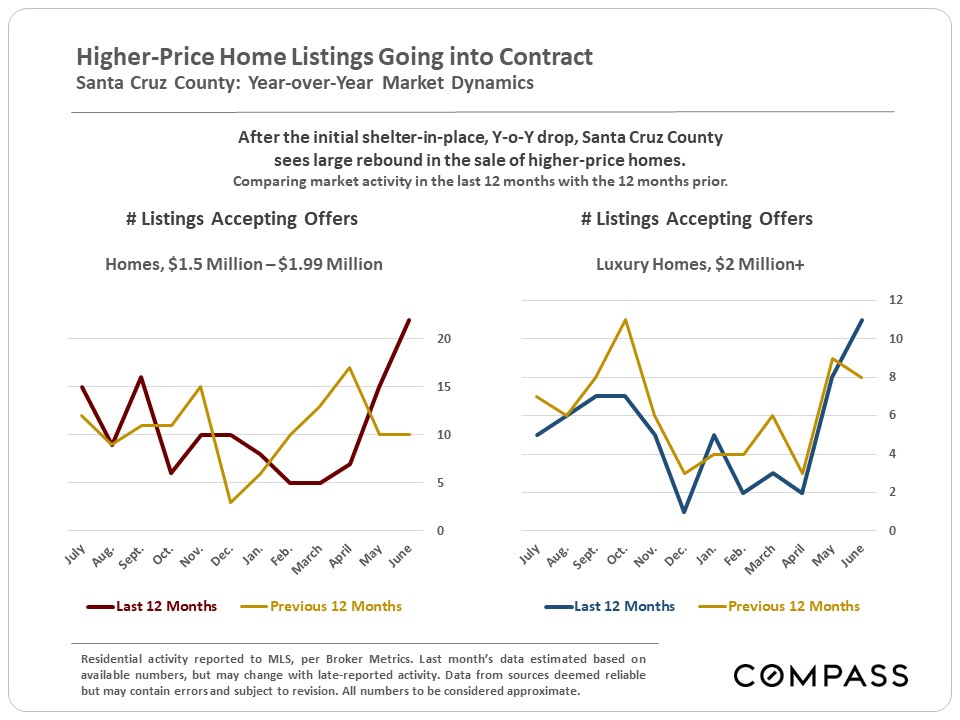
Recovering from the initial shelter-in-place drop in sales activity, Santa Cruz County has now jumped well above the highest points of the past 2 years. The first 2 charts below illustrate the big rebound in listings accepting offers in both the general residential market and the higher-price home segment.
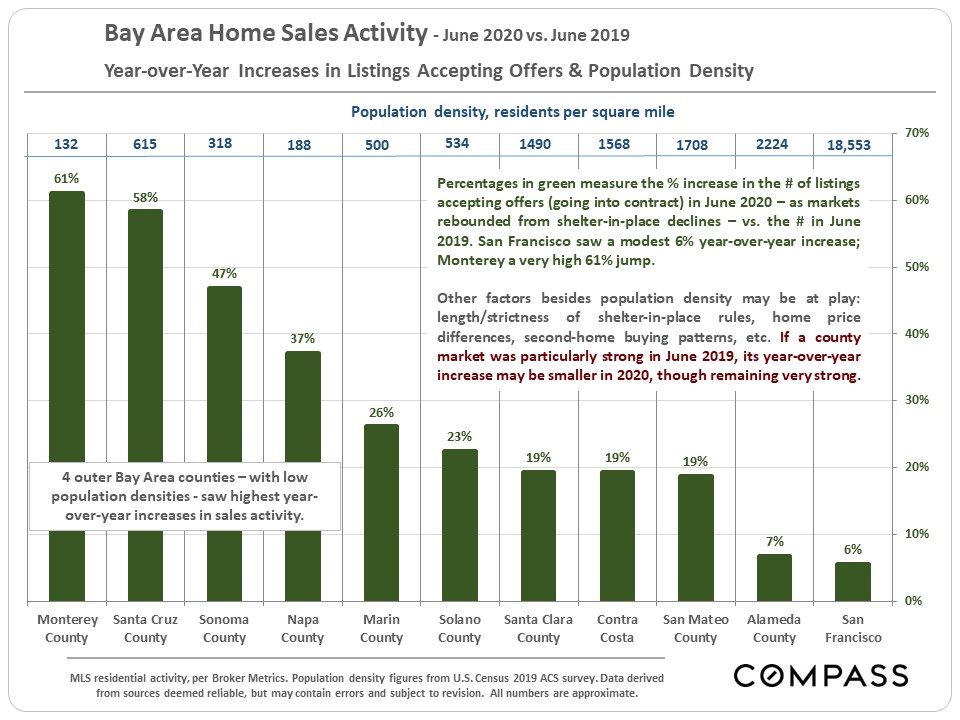
The Bay Area markets with the largest year-over-year increases in the number of listings accepting offers in June 2020 were the 4 outer Bay Area counties of Monterey (up 61%), Santa Cruz (58%), Sonoma (47%) and Napa (37%). They also have among the lowest population densities in the Bay Area. The more urban counties saw more modest y-o-y increases: San Francisco (6%) and Alameda (7%).
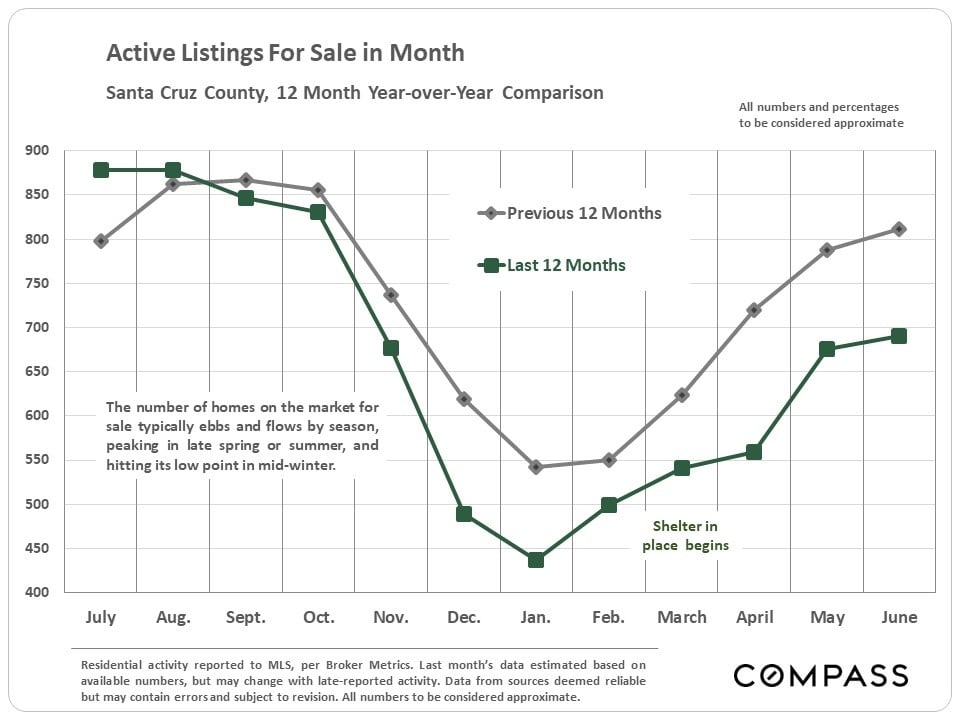
The year began with a relatively low inventory of homes for sale, and though that number has been increasing, it is still well down year over year.
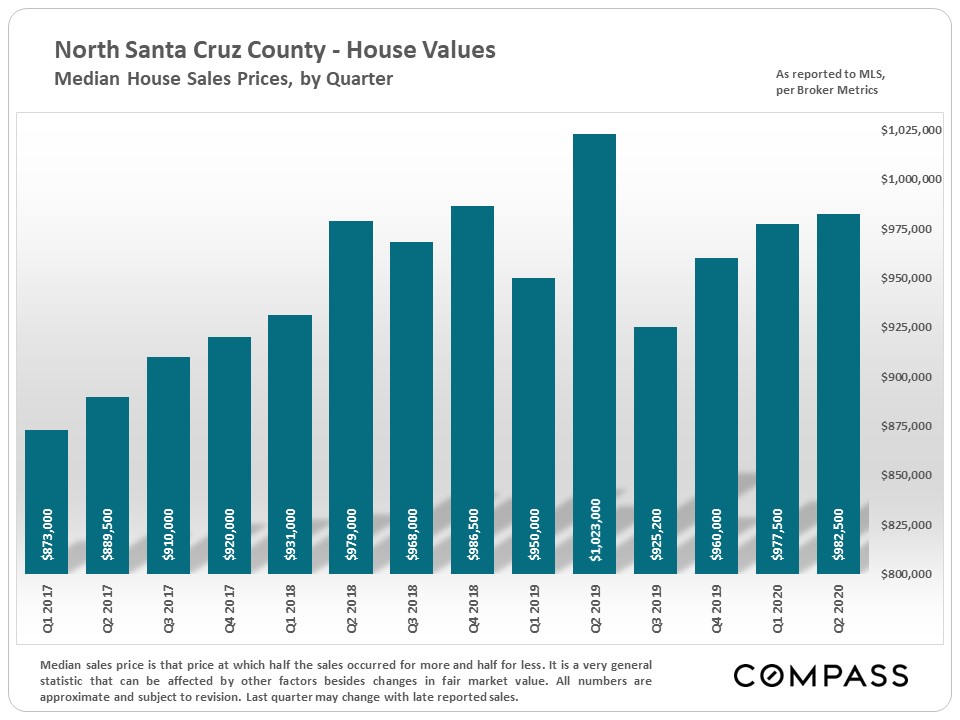
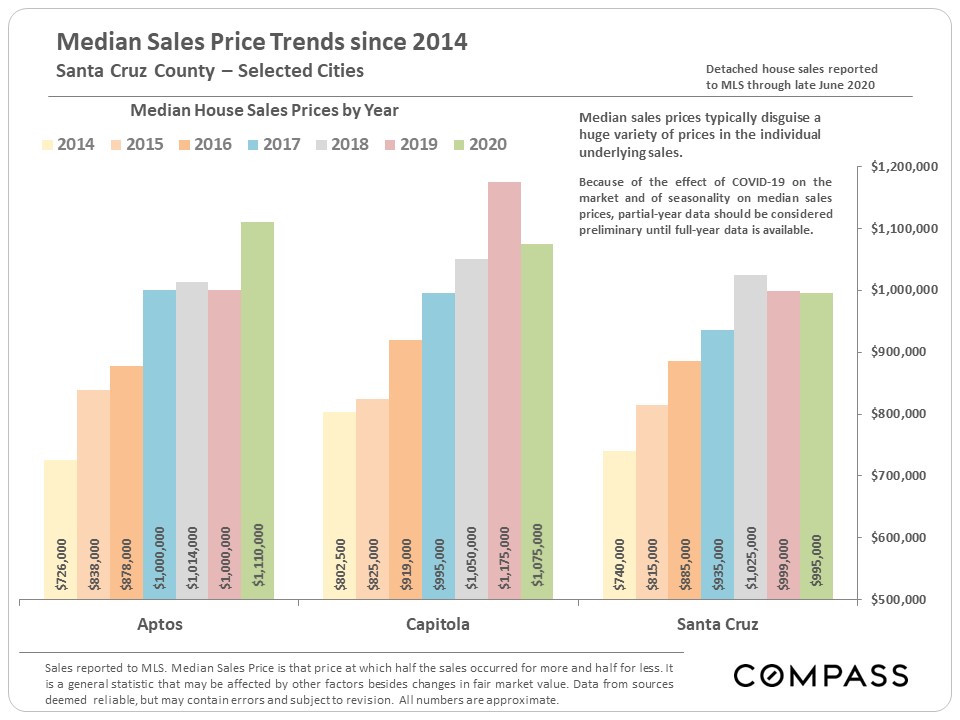
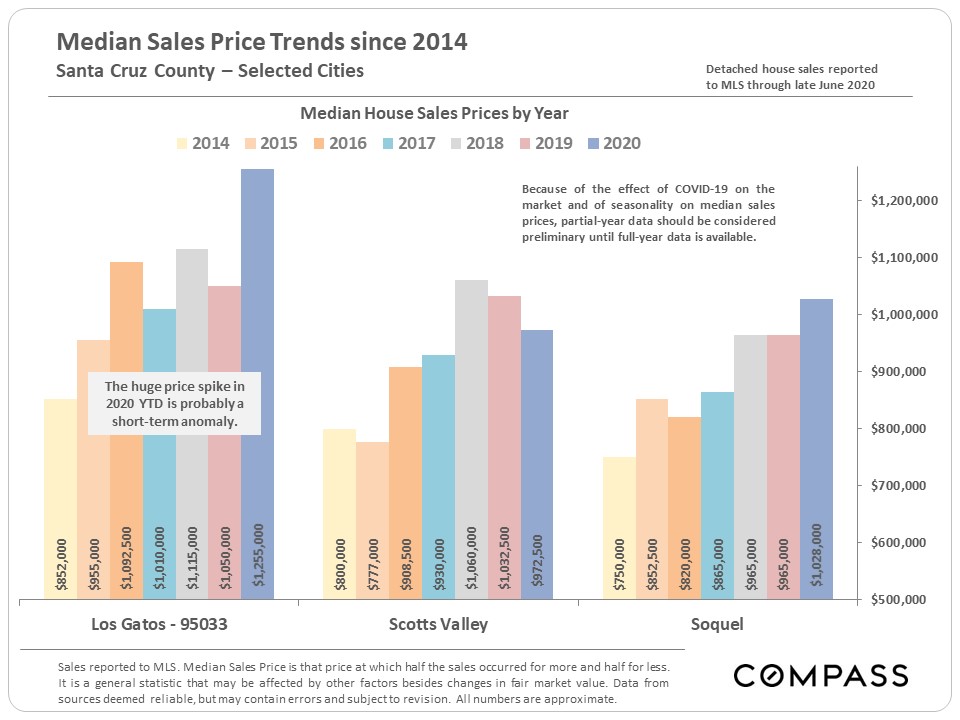
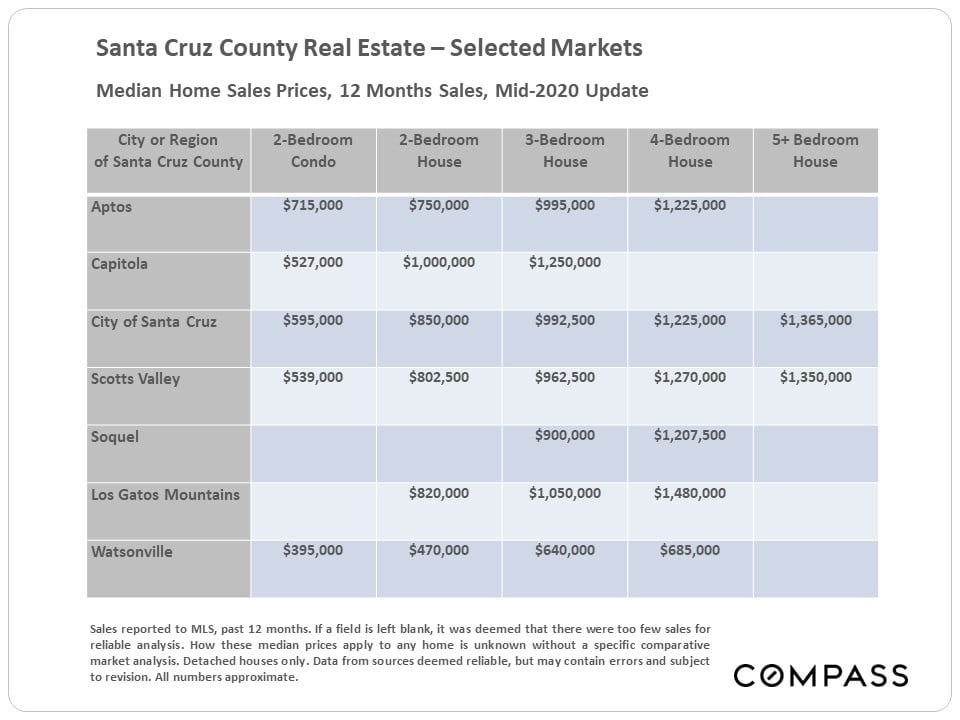
The next 4 charts look at median home sales prices from a variety of angles. Remember that median sales prices are not perfect indicators of changes in fair market value: They can fluctuate due to a number of other factors as well.
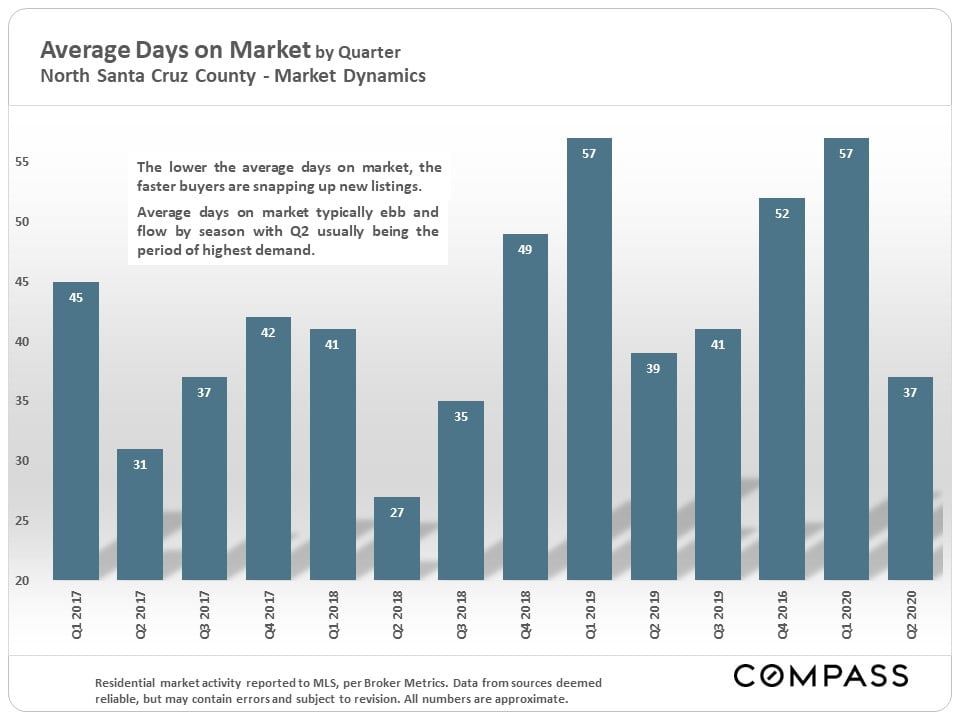
Average days on market were quite low in the last quarter, a common dynamic in Bay Area markets. The homes that sold went into contract relatively quickly.
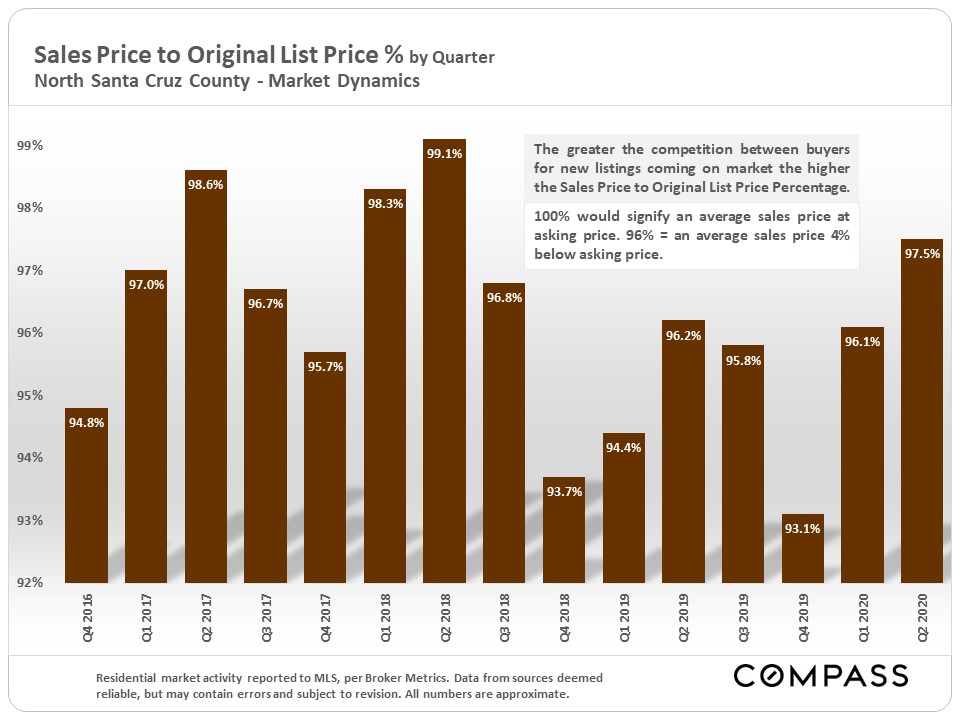
In Q2 2020, the average sales price was 2.5% below asking price.
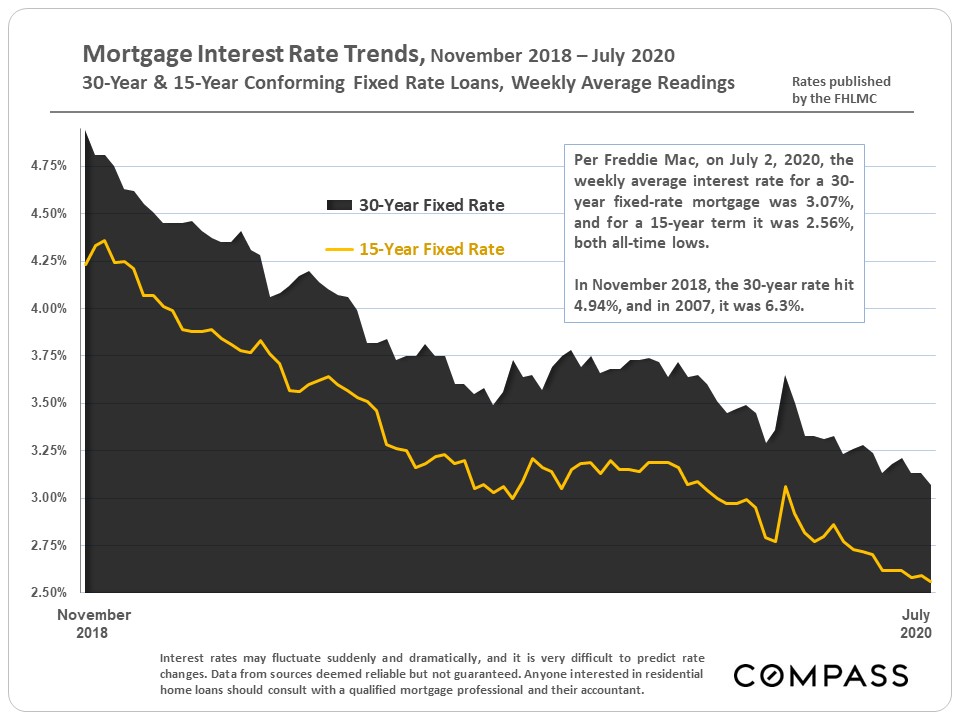
And interest rates hit another all-time low in early July, adding fuel to buyer demand.