Key Takeaways
Summary: The 2027 Best Move Report looks at Silicon Valley’s homeowners aged 60 and older using public data from the Census Bureau, NAR, C.A.R., Redfin, and the Santa Clara County Assessor. Homeowners 60+ head 42.7% of Santa Clara County’s owned homes, most of them own those homes free and clear, and the typical San Jose metro owner has stayed 18.7 years. Prop 13, an unindexed capital gains exclusion, and life circumstances shape who moves and when, which is why the long-predicted silver tsunami is still a steady trickle. With 2026 prices soft and 2027 rate forecasts ranging from 6.6% to 7.5%, life events rather than interest rates will keep driving most 60+ moves in 2027.
Table of Contents
- Why I Wrote This Report
- The 60+ Homeowner Quite Literally Owns Silicon Valley
- What Happened in 2026: The Year Rates Took a Round Trip
- The Lock-In Effect: Why Staying Put Is the Rational Move
- The Silver Tsunami Question: Still a Trickle, Not a Wave
- Where They Go When They Finally Move
- What’s Shaping Up for 2027
- Frequently Asked Questions
- Methodology and Sources
- About the Author
Why I Wrote This Report
Homeowners over 60 control more housing wealth in Silicon Valley than any other group, and almost nobody publishes data about what they’re actually doing with it. Every January brings a wave of housing forecasts about rates, prices, and first-time buyers. The people who own most of the homes around here, often free and clear, and who have the most riding on their next move, barely get a mention. This report is my attempt to fix that.
I’m Seb Frey, a Broker Associate at Compass in Los Gatos. I’ve spent more than 23 years selling homes in Silicon Valley and the Santa Cruz area, with over 460 closed transactions, and these days my practice centers on longtime homeowners and their families navigating downsizing, estate sales, and the big housing transitions that come later in life. I see this market from the inside every week, sitting at kitchen tables with people who bought their homes when Reagan was president and are now trying to figure out what comes next.
What you’ll find here is a look back at what happened in 2026 and a look ahead at what’s shaping up for 2027, built on public data from the Census Bureau, the National Association of REALTORS®, the California Association of REALTORS®, county records, and major housing research groups. Where I add my own observations from the field, I’ll say so plainly. The numbers focus on Santa Clara County as the core of Silicon Valley, with Santa Cruz County included where the data allows, since that’s where I work and where these patterns play out most dramatically.
If you’re a journalist or researcher, everything here is yours to cite with attribution, and the methodology section at the bottom spells out exactly where each figure comes from. If you’re a homeowner, I hope this helps you see that whatever you’re weighing right now, you’re not weighing it alone.
The 60+ Homeowner Quite Literally Owns Silicon Valley
Start with the number that frames everything else in this report: homeowners aged 60 and older head 155,619 of Santa Clara County’s 364,497 owner-occupied homes. That’s 42.7% of all the owned housing in the county, according to the Census Bureau’s 2024 American Community Survey. Add in the 55-to-59 crowd and you’re at nearly 55%. Over the hill in Santa Cruz County, it’s even more striking: 55.3% of owner households are headed by someone 60 or older, an outright majority.
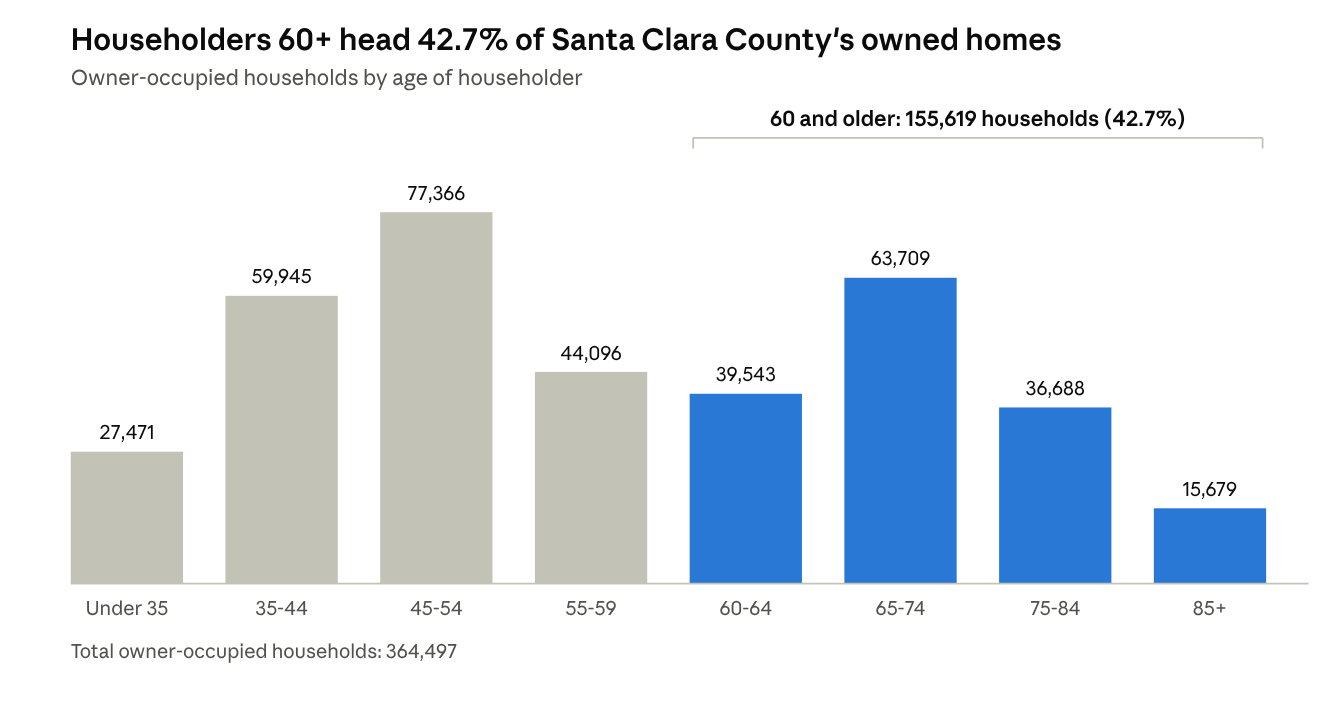
Source: U.S. Census Bureau, ACS 2024 1-year estimates, table B25007, via Census Reporter
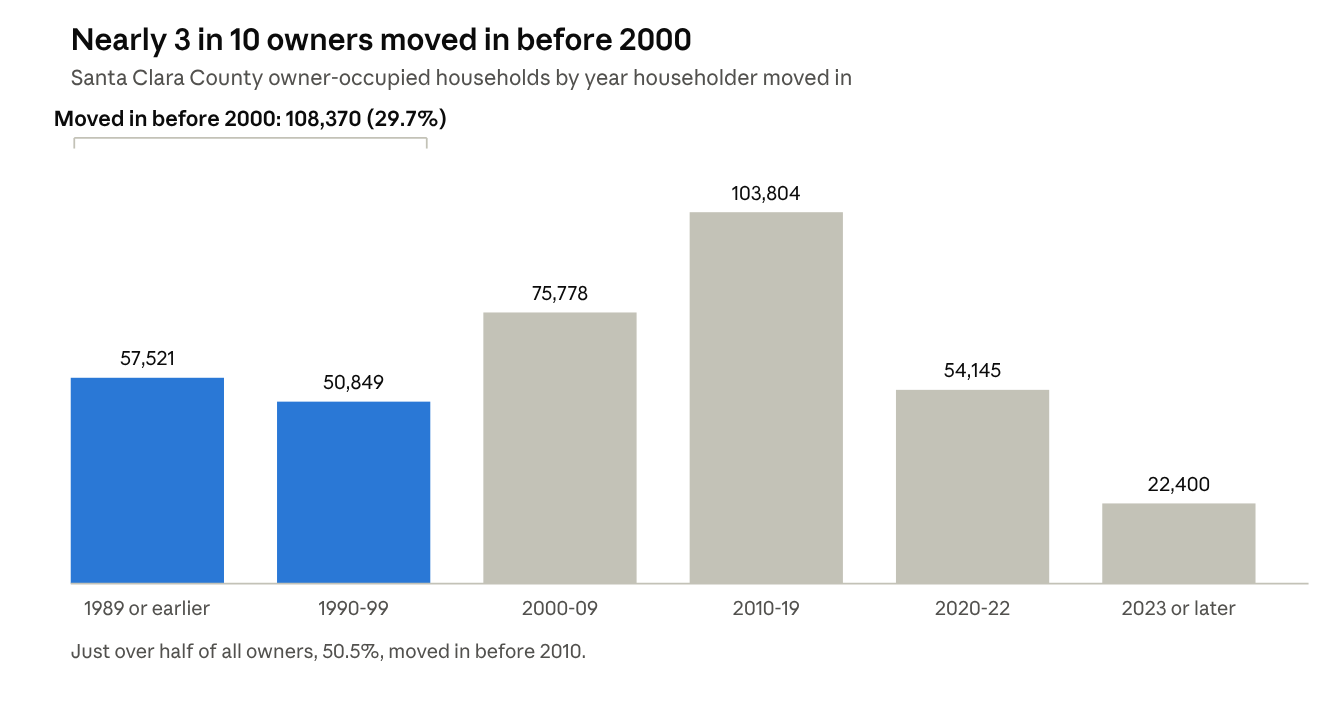
They’ve also been here a long time. The typical homeowner in the San Jose metro has owned their home for 18.7 years, the second-longest tenure of any major metro in the country behind only Los Angeles, per Redfin’s 2026 analysis. The national median is 12 years. Back in 2005 it was just 6.5 years nationally, so Silicon Valley owners now stay roughly three times as long as the typical American homeowner did two decades ago. The Census data tells the same story from a different angle: 29.7% of Santa Clara County’s owner households moved in before 2000, and 50.5% moved in before 2010.
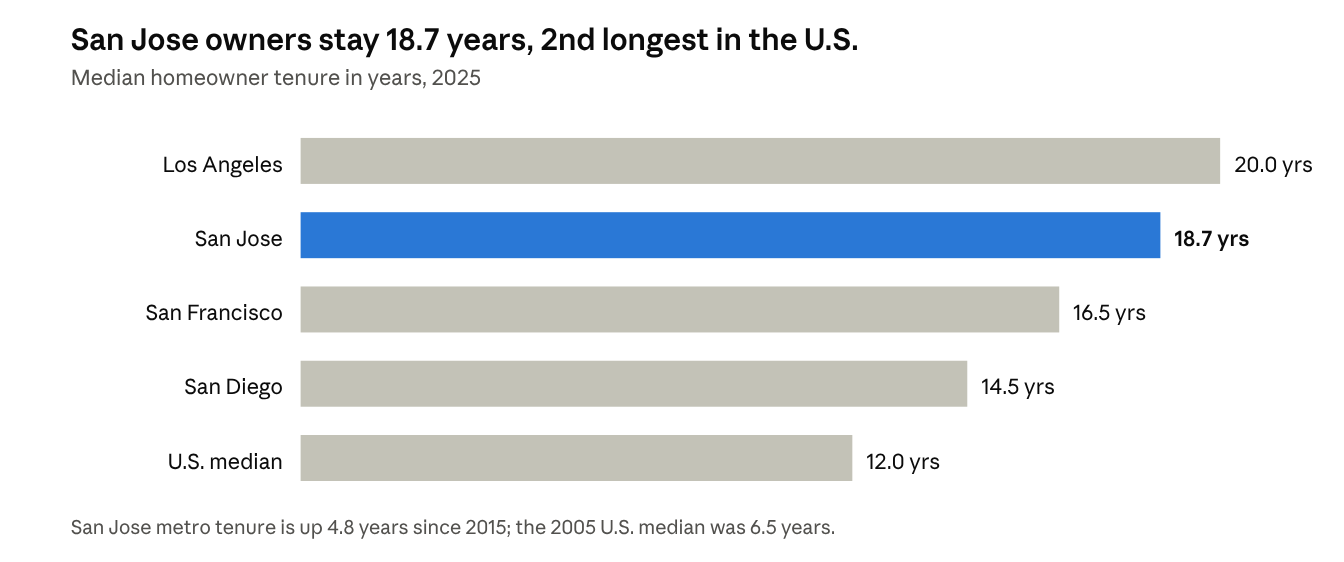
Source: Redfin analysis of county records, 2025 median tenure, published March 2026
And they own these homes outright at remarkable rates. Among 60+ owner households in Santa Clara County, 53.6% have no mortgage at all. For owners 65 and older, it’s 57.2%, and the pattern is nearly identical in Santa Cruz County. With the county’s median owner-occupied home valued at $1.49 million by the Census Bureau and C.A.R. reporting a $1.92 million median single-family sale price in September 2026, we’re talking about one of the largest concentrations of debt-free housing wealth on the planet.
The national picture rhymes with ours, just at lower price points. Americans 65 and older own 29.6 million homes, about 34% of all owner-occupied housing in the country, worth an estimated $13.8 trillion, according to NAHB’s analysis of Census data. Homeowners 62 and older crossed $15 trillion in collective home equity for the first time in mid-2026, hitting a record $15.34 trillion, per the NRMLA/RiskSpan Reverse Mortgage Market Index. Roughly two-thirds of all mortgage-free homeowners in America are 65 or older.
Here’s why this matters for everyone, not just the folks holding the deeds. When four out of ten owned homes in a county belong to people at or near retirement age, the decisions those households make about staying, selling, remodeling, or passing the home to their kids become the single biggest force shaping local housing supply. The rest of this report is about what those decisions actually looked like in 2026, and what’s coming in 2027.
What Happened in 2026: The Year Rates Took a Round Trip
If you only remember one thing about the 2026 housing market, make it this: mortgage rates fell below 6% in February for the first time in years, and by early October they had blown right back past 7%. NPR covered the February dip when Freddie Mac’s benchmark 30-year rate hit 5.98%, and then covered the climb back over 7% in late September. By mid-October the 30-year fixed sat at 7.33%, per Freddie Mac data cited in Fannie Mae’s October outlook. That whipsaw defined the year. The spring window brought buyers out, and the fall spike sent many of them right back to the sidelines.
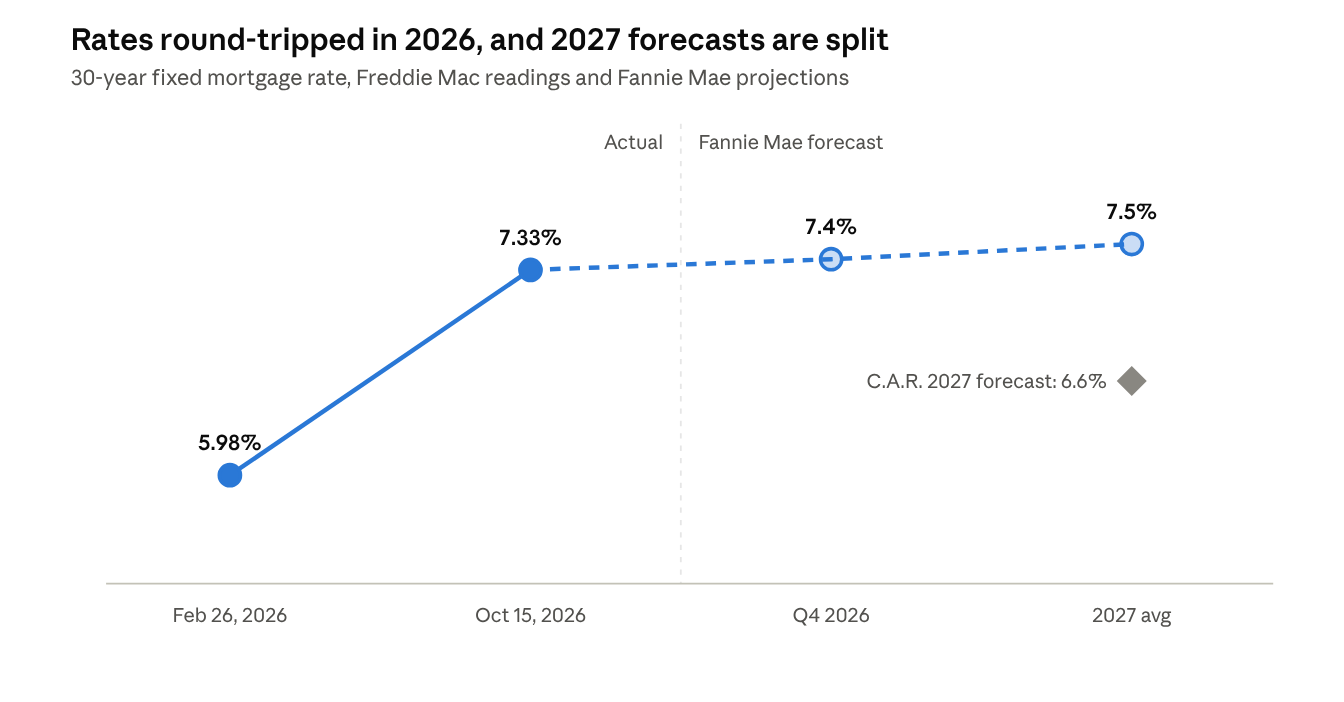
Source: Freddie Mac PMMS readings via NPR and Fannie Mae’s October 2026 outlook; C.A.R. 2027 Housing Market Forecast
Against that backdrop, Silicon Valley had a genuinely soft year by our standards. Here’s the September 2026 scoreboard from the California Association of REALTORS®:
| Area | Median price (Sep 2026) | Change vs. Sep 2025 |
|---|---|---|
| Santa Clara County | $1,920,000 | -4.0% |
| Santa Cruz County | $1,250,000 | +1.2% |
| S.F. Bay Area | $1,325,000 | +1.9% |
| California | $899,720 | +1.7% |
Read that top line again. Santa Clara County’s median single-family price was down 4% year over year in a month when the state and the broader Bay Area were both up. SCCAOR’s local MLS data showed the same thing: a $1.88 million September median, down 4% from a year earlier, with homes taking 27 days to sell versus 25 the year before. Statewide, C.A.R. expects 2026 to close with sales down 1.1% and the median price up just 0.8%, which would make it the flattest year for California prices in a long while.
The softness wasn’t evenly distributed, and that detail matters a lot for longtime homeowners. The Santa Clara County Assessor’s new annual report put 24,727 properties into Proposition 8 decline status this year, nearly triple last year’s count, and most of them were condos and townhomes. Single-family homes in good condition held up far better than the attached-home market. If you’re a 60+ homeowner thinking about trading a big house for a smaller condo, 2026 actually moved the math in your favor: the thing you’d sell held most of its value while the thing you’d buy got noticeably cheaper.
One more 2026 note worth keeping: even in a down year, the county’s total assessment roll grew 4.7% to a record $760.1 billion, with changes of ownership contributing the largest share of that growth. Homes here keep changing hands at prices far above their old Prop 13 assessed values, which tells you the sales that did happen were overwhelmingly longtime owners finally making a move.
The Lock-In Effect: Why Staying Put Is the Rational Move
People love to say Silicon Valley seniors are “sitting on” their homes, as if it were stubbornness. It isn’t. For most longtime owners here, staying put is the financially rational choice, because California has built three separate locks on the front door.
Lock number one is Proposition 13. A homeowner who bought in the 1980s or 1990s pays property taxes on an assessed value that can only rise 2% a year, no matter what the market does. Redfin’s economists point directly at California’s tax rules to explain why Los Angeles, San Jose, and San Francisco top the national tenure rankings. Sell the $1.9 million house with the $300,000 assessed value, buy a $1.5 million condo, and without relief your property tax bill could triple even though you downsized. Proposition 19 was supposed to be the key to this lock, and for many people it is: homeowners 55 and older can now transfer their low tax base to a replacement home anywhere in California, up to three times. But uptake has been modest. County assessors in Southern California reported only a few thousand base-year transfers each in the first years of the program, and in my experience most 60+ homeowners either haven’t heard of Prop 19 or assume it’s more complicated than it is. That gap between what the law allows and what people actually use is one of the biggest stories in this market.
Source: U.S. Census Bureau, ACS 2024 1-year estimates, table B25038, via Census Reporter
Lock number two is the capital gains tax, and it’s getting heavier every year. The federal exclusion on a primary home sale, $250,000 for singles and $500,000 for married couples, was set in 1997 and has never been adjusted for inflation. The median U.S. home cost $129,000 back then. Today, NAR data shows 62.2% of California homeowners have gains above the $250,000 line, and 30.8% are above the $500,000 line, the second-highest share of any state. In Santa Clara County, where the median sale price is $1.92 million and nearly a third of owners bought before 2000, a longtime owner with a seven-figure gain is the normal case, not the exception.
California then taxes those gains as ordinary income at rates up to 13.3%. NAR projects that by 2035, nearly 86% of California homeowners will exceed the $250,000 exclusion. Every year an owner waits, the tax penalty for selling grows, which is exactly backwards from what the housing market needs. (I walk through real numbers in my guide to capital gains tax when selling your home in Silicon Valley.)
Lock number three, the mortgage lock-in effect, matters least for this group, and that’s the interesting part. C.A.R. says low pandemic-era mortgage rates will keep many sellers on the sidelines through 2027. But remember: 53.6% of Santa Clara County’s 60+ owner households have no mortgage at all, and nationally about two-thirds of all mortgage-free homeowners are 65 or older. The 60+ homeowner is the one group largely immune to rate lock-in. When rates finally matter less, taxes and logistics matter more, which is why the sellers who do move in this market are almost always motivated by life, not by interest rates: a spouse’s health, stairs that stopped being friendly, grandkids in another state, or an estate to settle.

Time to talk to a REALTOR®?
Book a Call with Seb
Selling, buying or just weighing your options? Pick a time that works for you and we'll talk it through.
Pick a Time →Rather talk now? Call or text 408.413.3087
The Silver Tsunami Question: Still a Trickle, Not a Wave
For at least a decade, forecasters have warned that aging Boomers would flood the market with homes and sink prices. So is the wave finally here? The honest answer from the 2026 data is no, and the evidence keeps piling up on the “trickle” side of the argument.
Start with how few older Americans actually move. Only about 3.4% of the 65+ population relocated in 2025, roughly 2.1 million people out of more than 60 million, according to HireAHelper’s analysis of 15 million real moves. AARP’s Home and Community Preferences Survey finds 75% of adults 50 and older want to remain in their current home as they age, a number that has barely budged in years. And homeowner tenure is still rising, not falling: the San Jose metro’s 18.7-year median is up nearly five years just since 2015. If a tsunami were building, tenure would be shrinking. It’s doing the opposite.
Here’s the twist, though: older owners are already the biggest force in the market even while mostly staying put. Baby Boomers made up 55% of all U.S. home sellers and 42% of all buyers in NAR’s 2026 Generational Trends report, the largest share on both sides of the table. In a county where 60+ households hold 155,619 owned homes, even quiet turnover adds up fast. Run the simple math: if just 3% of those households sold in a given year, that would be roughly 4,700 Santa Clara County sales, a huge share of a market that closed 726 single-family sales this September. The “wave” isn’t coming someday. It’s already flowing, just as a steady, widening stream instead of a wall of water.
The demographics guarantee that stream keeps widening. More than four million Americans are turning 65 every year through 2027, the largest retirement surge in U.S. history, which the Alliance for Lifetime Income calls the “Peak 65” zone. And NAHB’s research adds the piece most forecasters miss: whatever homes older owners do release over the next decade or two won’t land evenly. Constrained, high-cost metros like ours have so much pent-up demand that released homes get absorbed almost instantly. Slower-growing regions may see a glut. Here in Silicon Valley, the silver tsunami is far more likely to show up as a long era of steady estate sales and downsizing moves than as a price-crushing flood. I wrote a deeper dive on the NAR numbers in my breakdown of the 2026 Generational Trends report if you want the full picture.
Where They Go When They Finally Move
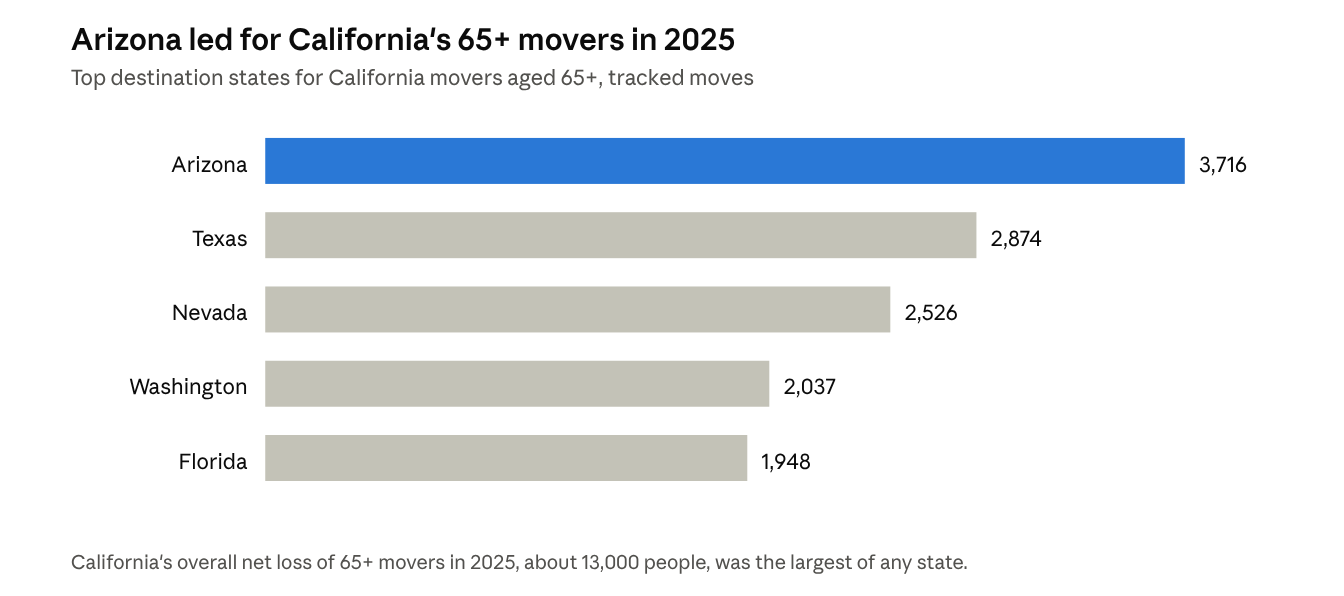
When Silicon Valley’s 60+ homeowners do sell, where do they end up? The national data gives us a clear picture of the out-of-state piece. California posted the largest net loss of retirement-age movers of any state in 2025, about 13,000 people, according to HireAHelper’s analysis of real move data. The top landing spots for California retirees were Arizona, Texas, Nevada, Washington, and Florida, in that order. Nationally, the biggest net winners for 65+ movers were South Carolina, Texas, North Carolina, Tennessee, and Arizona, which tells you the whole country’s retirees are chasing the same things: lower costs, lower taxes, and warm weather, with proximity to kids usually deciding which affordable state wins.
Source: HireAHelper analysis of PGM real-move data, moves by adults 65+ during 2025
The move itself is rarely about the house. In NAR’s generational data, the number one reason older sellers gave for moving was the desire to be closer to friends and family, cited by 41% of sellers, well ahead of any financial motivation. That matches what I see at kitchen tables all over the valley. The conversation almost never starts with cap rates or comps. It starts with a daughter in Roseville, a son in Austin, or a knee that has opinions about the staircase.
In my practice, these moves sort into three broad paths. Some families stay close, trading the big Eichler or ranch house for a single-level home, a condo, or a senior community nearby, and 2026’s softer condo prices made that trade more attractive than it’s been in years. Others stay in California but head for lower-cost regions like the Sacramento area, the Central Valley, or the Central Coast, and this is where Proposition 19 quietly stacks the deck, because the property tax base only travels to a replacement home inside California.
A couple leaving a $1.9 million Cupertino house can carry a 1980s tax basis to a home in El Dorado Hills, but not to one in Scottsdale. The third path leads out of state, where the equity from one Santa Clara County home can buy a house outright, fund retirement, and still leave money for the grandkids’ college accounts. There’s no single right answer, but the families who do best are the ones who compare all three paths on paper before putting up a sign. You can see how real families worked through these choices in my client case studies.
What’s Shaping Up for 2027
The big forecasters agree on the shape of 2027 and disagree sharply on the single number that matters most: mortgage rates. Here’s where the major projections stood as of late October 2026:
| Forecast | 2027 outlook | Source |
|---|---|---|
| C.A.R. sales | 277,900 CA home sales, up 3.7% | 2027 Housing Market Forecast |
| C.A.R. price | CA median $894,400, up 1.4% | Same |
| C.A.R. rates | 6.6% average 30-year rate | Same |
| Fannie Mae rates | About 7.5% throughout 2027 | October 2026 outlook |
That rate gap is enormous. C.A.R. built its forecast around 6.6%, essentially flat for a third straight year, while Fannie Mae raised its 2027 projection from 6.7% all the way to 7.5% in a single October revision after Treasury yields jumped. If Fannie is right, C.A.R.’s modest sales rebound probably doesn’t happen, and 2027 looks a lot like late 2026: slow sales, flat-to-soft prices, and buyers who need a reason beyond rates to act. C.A.R.’s own chief economist flagged in the September sales report that falling pending sales point to more softening ahead, even if prices don’t follow sales down.
For 60+ homeowners, I’d pull four practical threads out of all this. First, nobody credible is forecasting meaningful price growth here in 2027, so waiting another year to sell is unlikely to be rewarded with a bigger number, while the capital gains meter keeps running and another year of deferred maintenance accrues. Second, the demographic engine doesn’t care about rates: more than four million Americans turn 65 every year through 2027, estates keep getting settled, and the probate and trust-sale pipeline in this valley keeps growing no matter what the Fed does.
Third, keep one eye on Washington, because NAR is actively pushing to index the capital gains exclusion to inflation, and its polling shows 82% of voters support the change. If that reform passes in any form, it would unlock more Silicon Valley inventory than any rate cut ever could, and it would transform the math for almost every longtime owner reading this. And fourth, expect the gap between well-prepared homes and everything else to widen. In a market with choosy buyers and 27-day marketing times, the longtime family home that’s been thoughtfully prepped, priced on real comps, and marketed properly will keep commanding a premium over the one that hits the market as-is.
The honest bottom line for 2027: a market that stays stuck for people waiting on rates, and a perfectly workable market for people whose timeline is driven by life. In my world, that second group is almost everybody.
Frequently Asked Questions
Is 2027 a good time for seniors to sell a home in Silicon Valley?
If your timeline is driven by life rather than by the market, yes, it’s a workable time. Nobody credible is forecasting meaningful price growth in Santa Clara County for 2027, so waiting is unlikely to earn you a higher price, while capital gains exposure and home maintenance costs keep growing. Well-prepared single-family homes are still selling in under a month at strong prices, and softer condo prices have actually made the downsizing trade more attractive.
Will Santa Clara County home prices go up or down in 2027?
The forecasts cluster around flat. C.A.R. projects California’s median price up just 1.4% in 2027, and Santa Clara County entered the year with its median down 4% year over year. If mortgage rates stay near Fannie Mae’s projected 7.5%, flat to slightly soft is the most likely path, with single-family homes continuing to hold up better than condos and townhomes.
What is the silver tsunami, and will it crash Bay Area home prices?
The silver tsunami is the prediction that aging Baby Boomers will flood the market with homes and push prices down. The data says it’s a trickle, not a wave: only about 3.4% of Americans 65 and older moved in 2025, 75% tell AARP they want to age in place, and homeowner tenure in San Jose is still rising. Research from NAHB also shows that high-demand, supply-constrained metros like ours absorb released homes almost instantly, so a price crash from boomer selling is very unlikely here.
How does Prop 19 help California homeowners over 55?
Proposition 19 lets homeowners who are 55 or older, severely disabled, or wildfire victims sell their primary home and transfer their low Prop 13 property tax base to a replacement home anywhere in California, up to three times. If the new home costs more than the old one sold for, the difference gets added to your transferred base, but you keep the bulk of your old assessment. It only works within California, which is one reason many longtime owners who want to keep their tax savings downsize in-state. The details matter, so talk to a tax professional and the county assessor before you count on it.
How much capital gains tax will I pay when I sell a longtime Bay Area home?
It depends on your purchase price, the improvements you’ve documented, and your filing status, but for longtime owners here the bill is often substantial. The federal exclusion shields $250,000 of gain for singles and $500,000 for married couples, and it hasn’t been adjusted since 1997. With Santa Clara County’s median sale price at $1.92 million, NAR data shows most longtime California owners now exceed those limits, and California taxes the rest as ordinary income at rates up to 13.3%. The good news is that basis step-ups, documented improvements, and smart timing can meaningfully change the outcome, so run the numbers with a CPA before you assume the worst.
Where do most Bay Area retirees move when they sell?
More stay nearby than the headlines suggest, usually trading into a single-level home, condo, or senior community close to family. Among those who leave California, the top destinations for retirement-age movers in 2025 were Arizona, Texas, Nevada, Washington, and Florida. The deciding factor is rarely the house itself: in NAR’s data, the top reason older sellers move is to be closer to friends and family.
Methodology and Sources
Geographic definition. In this report, “Silicon Valley” means Santa Clara County, with Santa Cruz County figures included where noted. Redfin’s tenure data covers the San Jose metro area. That’s narrower than some definitions and wider than others, but it matches where the data is cleanest and where my practice operates.
How the local figures were calculated. The homeownership-by-age, year-moved-in, and mortgage-status figures come from the U.S. Census Bureau’s 2024 American Community Survey 1-year estimates, tables B25007 (Tenure by Age of Householder), B25038 (Tenure by Year Householder Moved Into Unit), and B25027 (Mortgage Status by Age of Householder), retrieved through Census Reporter. Shares were computed by summing the relevant age brackets and dividing by total owner-occupied households (364,497 in Santa Clara County; 56,865 in Santa Cruz County). ACS 1-year estimates carry margins of error, so treat figures as close estimates rather than exact counts.
A note on what this report is not. Every number here comes from the public sources below, not from my own client files, and none of it is tax, legal, or investment advice. Where I add observations from my own practice, I say so in plain language, and those observations are experience, not statistics.
Sources.
- U.S. Census Bureau, American Community Survey 2024 1-year estimates, via Census Reporter and Census QuickFacts, Santa Clara County
- NAR, 2026 Home Buyers and Sellers Generational Trends Report (April 2026)
- Redfin, homeowner tenure analysis (March 2026)
- NRMLA/RiskSpan Reverse Mortgage Market Index, Q2 2026, via HousingWire and NRMLA Q1 2026 release
- C.A.R., September 2026 home sales and price report and 2027 California Housing Market Forecast
- SCCAOR, Santa Clara County housing statistics, September 2026
- Santa Clara County Assessor FY 2026-27 annual report, via San José Spotlight
- NAHB Eye on Housing, “The Silver Tsunami Isn’t Landing Where It’s Needed Most” (April 2026)
- NAR capital gains research hub and NAR state-level data via Realtor.com
- HireAHelper/PGM, 2026 retirement migration study
- AARP, 2024 Home and Community Preferences Survey
- California State Board of Equalization, Proposition 19 and county assessor Prop 19 transfer counts via bubbleinfo.com
- Alliance for Lifetime Income, Peak 65 research
- Fannie Mae October 2026 outlook, via The MortgagePoint; NPR on sub-6% rates (Feb 2026) and NPR on rates topping 7% (Sep 2026)
Citing this report. Journalists, researchers, and bloggers are welcome to cite any figure or chart in this report with attribution to “The 2027 Best Move Report, Seb Frey, Compass” and a link to this page. For interviews, custom data cuts, or local commentary on the 60+ housing market, call (408) 413-3087.
About the Author
Seb Frey is a Broker Associate at Compass in Los Gatos (CA DRE# 01369847) with more than 23 years of Silicon Valley real estate experience and over 460 closed transactions, placing him ahead of 97% of agents working today. He has been ranked in the top 1.5% of agents nationwide by RealTrends and was named REALTOR® of the Year for his 2024 service. Through his Team Sixty Plus practice, Seb specializes in helping longtime homeowners, older adults, and their families navigate downsizing, estate and trust sales, and later-life housing transitions using his Best Move Method.
Seb holds the Seniors Real Estate Specialist (SRES®) designation, is a Certified Senior Advisor (CSA)®, a Certified Aging in Place Specialist (CAPS), and a Certified Probate Real Estate Specialist (CPRES), and is an Affiliate Member of the Professional Fiduciary Association of California. He contributed the chapter “Strategic Home Selling for Life Transitions” to the National Aging in Place Council’s 2026 book, Aging in Place Conversations: The Housing Edition, and hosts the Sixty Plus Uncensored podcast on funding your lifestyle over 60.
For media inquiries, speaking requests, or a complimentary Best Move Strategy Session, call (408) 413-3087 or visit sebfrey.com.
Time to talk to a REALTOR®?
Book a Call with Seb
Selling, buying or just weighing your options? Pick a time that works for you and we'll talk it through.
Pick a Time →Rather talk now? Call or text 408.413.3087