
Saratoga housing market: November 2026 update
Data through October 2026. Updated November 21, 2026.
Every figure in this report covers single-family homes only. Condos, townhouses and buildings with 2 to 4 units are left out, so the prices, sales counts and supply here won't match figures that mix every type of home.
Saratoga home price key metrics
Current market statistics for Saratoga single-family homes over the last 3 months, through October 2026:
- Homes sold: 64 (Aug 2026 to Oct 2026)
- Median sale price: $4,297,549 (about the same as a year earlier)
- Typical single-family home value: $4,105,397 (up 3.8% from a year earlier)
- Median price per square foot: $1,605
- Median days on market: 17
- Average sale price to list price: 102.0%
- Sold above asking: 52%
- Months of supply: 1.6
- Price per square foot, average yearly change over 5 years (2021 to 2026): 4.5%
- Price per square foot, average yearly change over 10 years (2016 to 2026): 5.9%
Seller's market. Seller conditions rate 8 out of 10 and buyer conditions 4 out of 10, based on single-family home sales over the last 3 months through October 2026 compared with a year earlier.
What's my Saratoga home worth?
See what your home is really worth with multiple valuations side by side, each with a confidence score so you know which number to trust. It updates as the market moves, so you'll always know where your equity stands.
Saratoga Market Brief
Key Takeaways
As of November 21, 2026, Saratoga is in a strong seller's market. Single-family homes sold for a median of $4,297,549, essentially flat compared with a year earlier, though the median price per square foot rose 5.6% to $1,605. More homes sold, 64 versus 48 a year earlier, yet buyers took longer to complete their purchases: the median home spent 17 days on the market, up from 9 days a year ago. Despite that slowdown, 51.6% of homes sold above asking price, down from 56.2% a year earlier but still a strong showing. Only 41.9% sold below asking, up from 35.4% the prior year. The typical single-family home value was $4,105,397, up 3.8% from a year earlier.
Tight supply continues to favor sellers. Inventory stood at 32 homes, up 14.3% from last year but still representing just 1.6 months of supply, well below the three-month threshold where supply and demand typically balance. New listings dropped 6.2% year-over-year to 61, while pending sales rose 7.4% to 58, keeping downward pressure on the homes available to browse. Fewer than four in ten homes went under contract within two weeks, a sharp drop from 68.5% a year earlier, suggesting buyers have slightly more time to decide even as inventory remains constrained. Meanwhile, 19.9% of homes for sale carry a price cut, up from 15.1% a year ago, hinting that some sellers are adjusting to higher mortgage rates and slower buyer urgency.
What's behind the rating
- About 1.6 months of supply. Under 3 months usually means more buyers than homes for sale.
- The typical home was on the market 17 days before going under contract.
- Homes sold for 102.0% of list price on average, and 52% sold above asking.
- 20% of homes for sale have cut their asking price (Zillow).
Saratoga market by the numbers
| Measure | Last 3 months | vs. year ago |
|---|---|---|
| Median sale price | $4,297,549 | +0.2% |
| Median price per sq ft | $1,605 | +5.6% |
| Homes sold | 64 | +33.3% |
| Average sale-to-list | 102.0% | -0.1 pts |
| Sold above list price | 52% | -4.6 pts |
| Median days on market | 17 days | +8 days |
| Months of supply | 1.6 | -0.2 months |
| New listings | 61 | -6.2% |
Saratoga home prices by year
Each row covers 12 months ending in October, so every year is complete and the years line up with each other.
| 12 months | Median price | Price per sq ft | Homes sold | Sale to list | Days on market |
|---|---|---|---|---|---|
| Nov 2025 to Oct 2026 | $4,374,525 | $1,591 | 230 | 102.8% | 14 |
| Nov 2024 to Oct 2025 | $4,267,904 | $1,549 | 218 | 103.9% | 11 |
| Nov 2023 to Oct 2024 | $4,015,164 | $1,531 | 244 | 105.3% | 14 |
| Nov 2022 to Oct 2023 | $3,817,443 | $1,445 | 176 | 101.6% | 15 |
| Nov 2021 to Oct 2022 | $3,887,097 | $1,451 | 231 | 108.0% | 17 |
| Nov 2020 to Oct 2021 | $3,452,620 | $1,274 | 375 | 108.1% | 12 |
| Nov 2019 to Oct 2020 | $2,813,903 | $1,026 | 310 | 100.5% | 31 |
| Nov 2018 to Oct 2019 | $2,794,328 | $1,015 | 320 | 99.8% | 38 |
| Nov 2017 to Oct 2018 | $2,884,486 | $1,111 | 259 | 105.0% | 16 |
| Nov 2016 to Oct 2017 | $2,505,153 | $954 | 301 | 103.5% | 24 |
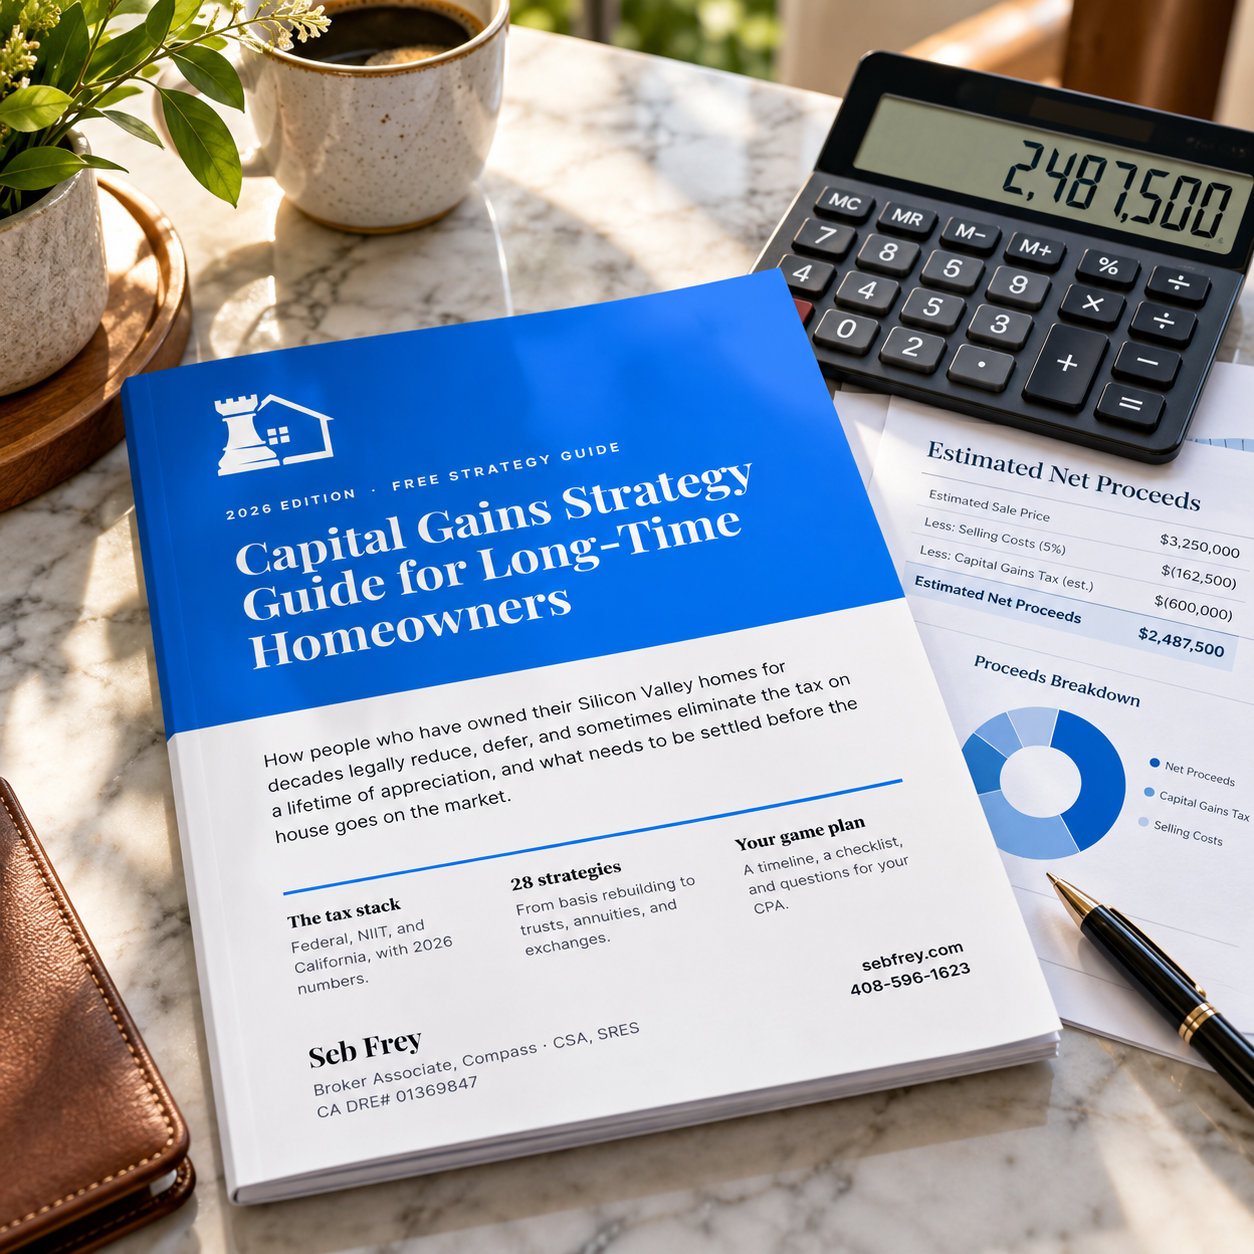
Free 2026 Strategy Guide
28 legal ways long-time owners cut their capital gains tax.
Know your options before you list.
If you've owned for decades, your gain may be well past the $250,000 and $500,000 exclusions. Know your options before you list.
- All 28 strategies, explained in plain English
- A real bracket-by-bracket example
- What to settle before your home hits the market
You're all set.Thanks! Your Capital Gains Strategy Guide is on its way to your inbox. If you don't see it in a few minutes, check your promotions or spam folder.
Saratoga vs Santa Clara County
How Saratoga compares with Santa Clara County as a whole. Saratoga's median price per square foot ran 46% above the Santa Clara County figure over the last 3 months.
| Measure | Saratoga | Santa Clara County |
|---|---|---|
| Median sale price | $4,297,549 | $1,915,715 |
| Median price per sq ft | $1,605 | $1,097 |
| Average sale-to-list | 102.0% | 103.2% |
| Sold above list price | 52% | 57% |
| Median days on market | 17 days | 15 days |
| Months of supply | 1.6 | 1.7 |
| Median price change vs a year earlier | +0.2% | -0.0% |
Want the bigger picture? 👉 Click here for the Santa Clara County November 2026 Report
Saratoga real estate trends
The charts below track the Saratoga single-family home market month by month. Each one shows a different side of supply and demand, and together they show whether conditions are tightening or loosening.
Saratoga median home sale price
The median sale price is the midpoint of every home that closed: half sold for more and half for less. It gives a better picture of a typical sale than the average, which one large estate sale can pull up. Over the last 3 months, the Saratoga median was $4,297,549, about the same as a year earlier. A median also moves with the mix of homes that happen to sell, so a stretch with more smaller homes can pull it down even when values haven't changed.

Saratoga home prices per square foot
Price per square foot adjusts for size, so it's often a steadier read on value than the median price when the mix of large and small homes selling shifts from month to month. Saratoga homes sold for a median of $1,605 per square foot over the last 3 months, up 5.6% from a year earlier. Over the last 10 years that works out to about 5.9% a year.

Saratoga sale price vs list price
Sale-to-list compares what a home sold for with its final asking price. Above 100% means buyers typically paid more than asking, which happens when several buyers compete for the same home, and below 100% means sellers were giving some ground. Saratoga homes averaged 102.0% of list price over the last 3 months, about the same as a year earlier.

Share of Saratoga homes selling over asking
This is the share of sales that closed above the asking price. It tends to move early when demand heats up or cools off, often before prices themselves change. Over the last 3 months, 52% of Saratoga sales went over asking, down 4.6 points from a year earlier.

Saratoga new listings vs homes sold
When new listings run ahead of sales for a while, supply builds up and buyers get more to choose from. When sales keep pace with or outrun new listings, the shelf stays thin. Over the last 3 months, Saratoga had 61 new listings and 64 homes sold.

Saratoga homes for sale vs pending sales
Homes for sale is the inventory on the market, and pending sales are homes that went under contract. A pending line climbing against flat or falling inventory means buyers are absorbing what gets listed. Saratoga averaged about 32 homes for sale over the last 3 months, up 14.3% from a year earlier.

Saratoga months of supply
Months of supply estimates how long the homes on the market would last at the recent pace of sales if nothing new were listed. Around 2 months or less usually goes with competitive conditions, while 5 to 6 months or more tends to give buyers more room to negotiate. Saratoga averaged 1.6 months over the last 3 months, down 0.2 months from a year earlier.

Saratoga days on market
Median days on market counts how long the typical home took to go under contract. It usually rises late in the year and drops in spring, so it's fairer to compare it with the same months a year earlier than with the month before. The Saratoga median was 17 days over the last 3 months, 8 days longer than a year earlier.

When Saratoga homes sell during the year
This chart averages home sales by calendar month across several years, with 100 standing for a typical month. Sales follow the calendar more than prices do, so a slow winter month isn't by itself a sign the market has turned. May has historically been the busiest month for Saratoga sales, running about 28% above an average month, and January the quietest, about 36% below.

Home values and rents
As of October 2026, Zillow puts the typical single-family home value in Saratoga at $4,105,397 (+3.8% vs a year earlier), next to a median sale price of $4,297,549 (+0.2% vs a year earlier). 19.9% of single-family listings have had a price cut. The typical single-family home value covers every single-family home in the area, not just the ones that sold, so it won't match the median sale price above.
Saratoga typical single-family home value
The typical single-family home value is an index of the middle of the market across every single-family home in the area, sold or not, so it moves more smoothly than sale prices and shows the longer trend.

Economic factors behind the Saratoga market
Borrowing costs, inflation, jobs and the stock market all shape how much buyers can spend and how many owners decide to sell. Here's where each one stood in the latest figures, and what it means for Saratoga.
The average 30-year fixed mortgage rate was 7.19% so far in November 2026, up 0.95 points from a year earlier. The 10-year Treasury yield, which mortgage rates tend to follow, averaged 4.99%, up 0.89 points from a year earlier. For a buyer putting 20% down on the Saratoga median-priced single-family home ($4,297,549), principal and interest come to about $23,310 a month, $2,170 more than at the rate a year earlier.
Consumer prices were up 3.7% over the year to September 2026, or 2.6% leaving out food and energy. In the Bay Area, prices were up 3.4% over the year to August 2026. Average hourly earnings grew 3.1% over the year to October 2026, which means paychecks are losing ground to prices.
Unemployment was 4.1% nationally in October 2026 and 5.0% in California. In the San Jose metro area it was 4.0% in September 2026, down 0.5 points from a year earlier.
The S&P 500 was up 10.9% from a year earlier so far in November 2026, and the tech-heavy Nasdaq up 8.2%. Because so much Bay Area pay and savings is tied to tech stock, the market's direction tends to show up in down payments and buyer confidence here. Nationally, the Housing Affordability Index from the National Association of REALTORS® was 100.7 in October 2026, compared with 107.3 a year earlier. A reading of 100 means a family earning the national median income has exactly enough to qualify for a mortgage on the national median-priced home with 20% down.
Mortgage rates and what they mean for Saratoga buyers
This chart puts the average 30-year fixed mortgage rate next to the 10-year Treasury yield. Lenders price mortgages off long-term Treasury yields plus a margin, so the two lines tend to move together, and the gap between them is that margin. Over the last five years the mortgage rate went from 3.10% in December 2021 to 7.19% in November 2026, with a high of 7.62% in October 2023. The gap is about 2.2 points right now, wider than the roughly 1.7 points that was typical before 2022, which keeps rates higher than the Treasury alone would suggest. On the median-priced Saratoga single-family home ($4,297,549) with 20% down, each one-point move in the rate changes principal and interest by about $2,370 a month. Higher rates also make owners with low rates locked in less willing to sell, which keeps fewer homes on the market.

Inflation and the Saratoga market
This chart tracks how fast consumer prices are rising compared with a year earlier, overall and without food and energy (the "core" rate the Federal Reserve watches most closely), plus the Bay Area's own rate. Inflation peaked at 9.0% in June 2022 over the last five years and stood at 3.7% in September 2026. Bay Area prices are rising more slowly than the national rate, 3.4% vs 3.7%. For Saratoga, inflation running above the Fed's 2% target keeps interest rates, and with them mortgage rates, higher for longer. It also raises the cost of insurance, repairs and upkeep that Saratoga owners pay, and the cost of getting a home ready to sell.

Wage growth vs inflation: buying power for Saratoga households
This chart compares how fast paychecks are growing with how fast prices are rising. When the wage line is above the inflation line, buying power is growing and households can save toward a down payment faster; when it's below, the same paycheck buys less each month. Right now wages are growing 3.1% a year against inflation of 3.7%, so paychecks are behind by about 0.6 points. Wage growth has ranged from 3.1% to 5.9% over the last five years. These are national averages, and many Saratoga buyers earn well above them, often with stock compensation on top. Still, slower real wage growth narrows the pool of buyers who can stretch to local prices, which tends to show up first at the entry level.

Jobs and the Saratoga housing market
This chart compares the unemployment rate in the San Jose metro area with California and the U.S. Jobs are what keep buyers in the market and owners current on their payments, so a rising rate tends to mean fewer buyers and, if it lasts, more homes coming up for sale. The San Jose metro rate was 4.0% in September 2026, about the same as the national rate, and it has ranged from 2.6% to 4.5% over the last five years. Demand for homes in Saratoga rises and falls with hiring at the region's big employers. A low local rate supports competition for homes, while a run of layoffs usually shows up as longer days on market before it shows up in prices.

The stock market and Saratoga buyers
This chart shows the S&P 500 and the Nasdaq Composite, both scaled so five years ago equals 100, so you can read the lines as growth since then. Over that stretch the S&P 500 is up about 60% and the tech-heavy Nasdaq up about 61%. In Saratoga, a large share of pay comes as company stock, so rising markets turn into down payments and all-cash offers here faster than almost anywhere else. A sharp drop works the other way, and can thin the buyer pool within weeks.

Housing affordability and Saratoga
This is the National Association of REALTORS® Housing Affordability Index. A reading of 100 means a family earning the national median income has exactly enough to qualify for a mortgage on the national median-priced home with 20% down; higher is more affordable, lower is less. It went from 107.3 in October 2025 to 100.7 in October 2026, with a low of 100.7 in October 2026. This is a national measure, and Saratoga prices sit far above the national median. Carrying the Saratoga median-priced single-family home ($4,297,549) takes a household income of around $1,229,000 a year at today's rates, so the chart shows the direction of affordability more than its level here.

Economic figures are national unless they name California, the Bay Area or a metro area; recent months can be revised. Sources: 30-year fixed mortgage rate (Freddie Mac via FRED); 10-year Treasury yield (U.S. Treasury via FRED); Inflation (CPI, year over year) (U.S. Bureau of Labor Statistics via FRED); Core inflation (excluding food and energy) (U.S. Bureau of Labor Statistics via FRED); Bay Area inflation (CPI, year over year) (U.S. Bureau of Labor Statistics via FRED); Wage growth (average hourly earnings, year over year) (U.S. Bureau of Labor Statistics via FRED); U.S. unemployment rate (U.S. Bureau of Labor Statistics via FRED); California unemployment rate (U.S. Bureau of Labor Statistics via FRED); San Jose metro unemployment rate (U.S. Bureau of Labor Statistics via FRED); S&P 500 (S&P Dow Jones Indices via FRED); Nasdaq Composite (Nasdaq OMX via FRED); Housing Affordability Index (fixed rate) (National Association of REALTORS® via FRED).
Saratoga real estate market forecast
The data indicate a reasonable projected change of +2.6% in Saratoga single-family home values over the next 12 months, to about $4.21 million by October 2027, with a likely range of -7.7% to +12.0%.
| Horizon | Month | Projected change | Typical value | Likely range |
|---|---|---|---|---|
| 3 months | January 2027 | +1.1% | $4.15 million | -1.7% to +3.5% |
| 6 months | April 2027 | +1.2% | $4.16 million | -4.5% to +6.1% |
| 9 months | July 2027 | +1.7% | $4.18 million | -6.3% to +9.2% |
| 12 months | October 2027 | +2.6% | $4.21 million | -7.7% to +12.0% |

The starting point is Saratoga's typical single-family home value of $4.11 million in October 2026, from the Zillow Home Value Index for single-family homes, which covers every single-family home in the area, not only the ones that sold. Condos, townhouses and multi-unit buildings aren't part of it.
Values are projected to keep climbing through the year: +1.1% by January, +1.2% by April, +1.7% by July and +2.6% by October. That is below the roughly 6.4% a typical year has brought California home values since 2010, the history the model learned from. Zillow doesn't publish a forecast for single-family homes on their own, so this projection comes from my market model alone, trained on single-family home values and single-family supply and demand.
What's moving the forecast
- There are 49.9% more homes for sale than a year ago across Santa Clara County, which takes about 1.7 points off the 12-month outlook.
- Mortgage rates are running about 1.1 points above their 5-year average, which takes about 1.2 points off the 12-month outlook.
- Mortgage rates are up about 1.1 points from a year ago, which takes about 0.5 points off the 12-month outlook.
How accurate is this forecast? I backtested my model month by month since January 2017: at each step it was trained only on data available at the time, then checked against what actually happened across Bay Area cities and towns. Its 12-month projections missed by 5.7 points on average, against 6.8 points for simply assuming prices stay flat, and it called the direction right 67% of the time. At 3 months the average miss was 1.5 points. The likely range is deliberately cautious: it's sized from past misses that include the 2022 rate shock, and in a test on 2024 to 2026 outcomes nearly all of them landed inside it.
A projection is an estimate of where area-wide typical home values are heading, not a promise, and not a valuation or appraisal of any home. It describes where the numbers point, not when anyone should buy or sell. Forecast sources: Zillow Home Value Index for single-family homes (Zillow Research); Redfin Data Center, single-family homes, a national real estate brokerage; Freddie Mac 30-year fixed mortgage rate, via FRED (Federal Reserve Bank of St. Louis).
Prop 19 Calculator
Can You Take Your Low Property Tax With You?
If you're 55 or older, Prop 19 may let you carry your current tax base to a new home anywhere in California. Plug in your numbers and see what your property taxes could look like after you move.
Saratoga home prices: frequently asked questions
What is the average home price in Saratoga?
Over the last 3 months through October 2026, the median sale price of single-family homes in Saratoga was $4,297,549, about the same as a year earlier. Across the last 12 months (Nov 2025 to Oct 2026) the median was $4,374,525. The median is the midpoint of every home that sold, which describes a typical sale better than an average, since one large sale can pull an average well above what most homes go for. Zillow's typical single-family home value, which covers every single-family home in the area and not only the ones that sold, was $4,105,397 as of October 2026.
Do these Saratoga home prices include condos and townhouses?
No. Every figure in this report covers single-family homes only. Condos, townhouses and buildings with 2 to 4 units are left out, so the prices, sales counts and supply here won't match figures that mix every type of home. Condos and townhouses usually sell for less than single-family homes in the same area and move at their own pace, so mixing them in would blur both pictures.
How many homes sold in Saratoga in the last 12 months?
230 single-family homes sold in Saratoga over the 12 months from Nov 2025 to Oct 2026, compared with 218 in the 12 months before that. Over the last 3 months through October 2026, 64 single-family homes sold.
How much do you need to make to afford a house in Saratoga?
At the Saratoga median single-family sale price of $4,297,549, a buyer putting 20% down ($860,000) would borrow about $3,438,000. At the national average 30-year fixed rate of 7.25% (Freddie Mac, week of November 19, 2026), principal and interest come to about $23,450 a month, and property taxes and homeowners insurance add roughly $5,370, for about $28,830 a month in all. Lenders commonly look for housing costs of no more than about 28% of gross income, which puts the household income needed at around $1,235,000 a year. Treat that as a rough guide: the actual tax rate, insurance, HOA dues, other debts, the size of the down payment and the rate a lender offers all move the number.
What ZIP codes are in Saratoga?
Saratoga homes use the 95070 ZIP code. 95071 is used for post office boxes.
How are the schools in Saratoga?
Most of Saratoga is served by the Saratoga Union School District and the Los Gatos-Saratoga Joint Union High School District, while parts of the city fall into the Cupertino Union, Campbell Union High and Fremont Union High districts. School assignments follow each district's attendance boundaries, which can change, so confirm a specific address with the district. Test results, graduation rates and other measures for every public school are published on the California School Dashboard.
Is Saratoga a buyer's or seller's market right now?
Seller's market, based on single-family home sales over the last 3 months through October 2026. Seller conditions rate 8 out of 10 and buyer conditions 4 out of 10, judged against the same months a year earlier. About 1.6 months of supply. Under 3 months usually means more buyers than homes for sale.
How fast are homes selling in Saratoga?
The typical Saratoga single-family home went under contract in 17 days over the last 3 months, 8 days longer than a year earlier. Homes sold for an average of 102.0% of their list price, and 52% sold above asking.
Are home prices going up or down in Saratoga?
Saratoga single-family homes sold for a median of $1,605 per square foot over the last 3 months, up 5.6% from a year earlier. Over the longer run, price per square foot changed by about 4.5% a year over 5 years and 5.9% a year over 10 years. Short swings in a small market often reflect which homes happened to sell, so the longer trend is the steadier read.
What is the Saratoga real estate market forecast for 2027?
The data indicate a reasonable projected change of +2.6% in Saratoga single-family home values over the next 12 months, to about $4.21 million by October 2027, with a likely range of -7.7% to +12.0%. The projection covers single-family homes and comes from my own market model, which reads recent single-family price momentum, supply and demand, and mortgage rates. A projection is an estimate of where area-wide typical home values are heading, not a promise, and not a valuation or appraisal of any home. It describes where the numbers point, not when anyone should buy or sell.
Home prices in nearby areas
- Campbell home prices
- Cupertino home prices
- Gilroy home prices
- Los Altos home prices
- Los Altos Hills home prices
- Los Gatos home prices
- Milpitas home prices
- Morgan Hill home prices
- Mountain View home prices
- San Jose home prices
- Santa Clara home prices
- Sunnyvale home prices
Sources: Redfin, a national real estate brokerage, and Zillow Research. Data through October 2026; updated November 21, 2026. Single-family homes only: condos, townhouses and buildings with 2 to 4 units are left out. City and ZIP figures cover rolling 3-month periods, so each chart point is the 3 months ending that month. Area-wide market conditions only, not an appraisal or valuation of any home.
What Moves Saratoga Home Prices
Saratoga looks uniform from the outside and really isn't, and an estimate that treats it as one market will be off before it starts. Down on the valley floor you have the postwar tracts, Saratoga Woods, Brookview, Quito and the Golden Triangle, flat lots on quiet streets where the houses went up within a few years of each other and buyers are shopping for lot size and school assignment. Up in the foothills, along Pierce, Bohlman, Mount Eden and the roads climbing toward Skyline, you have acreage, views and privacy along with a set of complications the flats never deal with, including septic systems, well water, private road agreements, and the city's Hillside Residential zoning, which limits what can be built and how much of the lot it can cover. Two homes with the same square footage, one in the Golden Triangle and one on a ridge above the Village, can sit a million dollars or more apart, and the automated valuation models handle the hillside side of that badly. If you want a feel for how the pieces of town compare, my Saratoga community page walks through the neighborhoods one at a time, from Bellgrove and Prides Crossing to the Platinum Triangle.
Schools do more quiet work in Saratoga than almost anywhere else in Silicon Valley, because four different K-8 districts serve addresses inside the city limits. Most of town is Saratoga Union feeding Saratoga High in the Los Gatos-Saratoga Joint Union High School District, but the Blue Hills area sits in Cupertino Union and feeds Lynbrook through Fremont Union High, while the Quito side of town falls into Moreland or Campbell Union with Prospect High as the assigned high school. Prospect sits physically inside Saratoga but belongs to the Campbell Union High School District, which confuses nearly everyone who hasn't lived here. The pricing consequence is blunt. Comparable homes with Moreland or Campbell schools generally trade below the same house with Saratoga or Cupertino schools, and the gap is wide enough to swamp anything a kitchen remodel would add. Before you set a price, confirm exactly which side of the line your address falls on, because the district boundaries have never followed the city boundaries.
Insurance has become a genuine pricing factor over the past few years for anything on the hillside or near the wildland edge. The city has mapped local fire hazard severity zones, and buyers now ask about insurability at the first showing rather than halfway through escrow. A home that can only be covered through the California FAIR Plan sells to a smaller and more cautious pool than one a standard carrier will still write, and that shows up in both the price and the days on market. It doesn't make a hillside home hard to sell, but it does mean you want the defensible space work done, the roof and the vents documented, and a quote in hand before the first open house rather than scrambling when a buyer's agent starts asking.
Condition and era matter more in Saratoga than in most of the county, because so much of the valley floor stock went up between the mid 1950s and the late 1960s, much of it on quarter-acre and larger lots, and a great deal of it has been owned by the same family ever since. That produces two very different buyers. One wants a finished house and will pay a real premium to avoid a project, and the other is a builder or a family with an architect who is buying the lot and the school assignment and treating the house as a starting point. Which buyer your home attracts decides almost everything about how you prepare it, and the answer isn't always obvious from the curb. Sometimes selling as-is to a builder nets more than a renovation would, and sometimes a targeted refresh through Compass Concierge returns several times what it costs. I've watched both play out here and in neighboring Cupertino, Los Gatos and West San Jose, and a few of those sales are written up in my case studies.
Free Seller Strategy Session
Before we talk money, let's talk about you.
The biggest financial wins in a move happen long before a home hits the market, and they start with understanding your situation. In 30 minutes we'll talk through what's changing, who's involved, and what you need this move to do for you, then map out a plan that gets you there with a clear financial advantage.
Book My Strategy Session →
If You've Owned Your Home for Decades
Most of the Saratoga homeowners I work with bought in the 1970s, 80s or 90s, and for them the value question arrives wrapped in a tax question. Your Prop 13 assessment might be a tenth of what the home would sell for today, which is wonderful while you own it and complicated the moment you start thinking about a move. Prop 19 is the part most people underestimate, because it lets homeowners 55 and older carry that low tax base to a replacement home anywhere in California, up to three times, and the replacement can cost more than what you sold for, with the difference added to your basis. For a family sitting on a Saratoga house worth several million and a tax bill set in 1982, that single rule is often the difference between feeling stuck and having real options. It changes the math on downsizing considerably, and I've put together a Prop 19 FAQ that covers the mechanics.
Capital gains are the other half of it, and in Saratoga they bite harder than almost anywhere. The federal exclusion of $250,000 for an individual or $500,000 for a couple was generous when it was written in 1997 and doesn't stretch far against a sale in the millions. There are real strategies for managing that exposure, starting with documenting every improvement you've made across the decades and running through timing and structure decisions, and the worst version of this is learning what you owe after the sale has already closed. IRS Publication 523 lays out the rules, and my home sale calculator will give you a rough sense of what you'd actually net. If you want to think it through before you commit to anything, that's exactly the conversation I have with longtime homeowners every week.
Get Your Saratoga Home Value
The instant estimate at the top of this page is a reasonable starting point, and the live data above tells you which way the market is leaning. What neither one can do is walk your property, check which school boundary you're actually in, look at your insurability, and tell you whether your home is a move-in sale or a lot sale. If you'd like that, I'll put together a proper valuation of your home's fair market value with no obligation and no pressure to list. Enter your address above to get started, or book a call and we'll talk it through.