
There’s no question that 2020 was unlike any year in living memory, and 2021 certainly got off to a rocky start. I’m optimistic that much of the turbulence is behind us, and that we’ll be looking forward to a year of regrowth and relative normalcy. This Santa Clara County 2020 Real Estate Wrap-Up will be looking back on the year as a whole, rather than looking forward to what 2021 has in store.
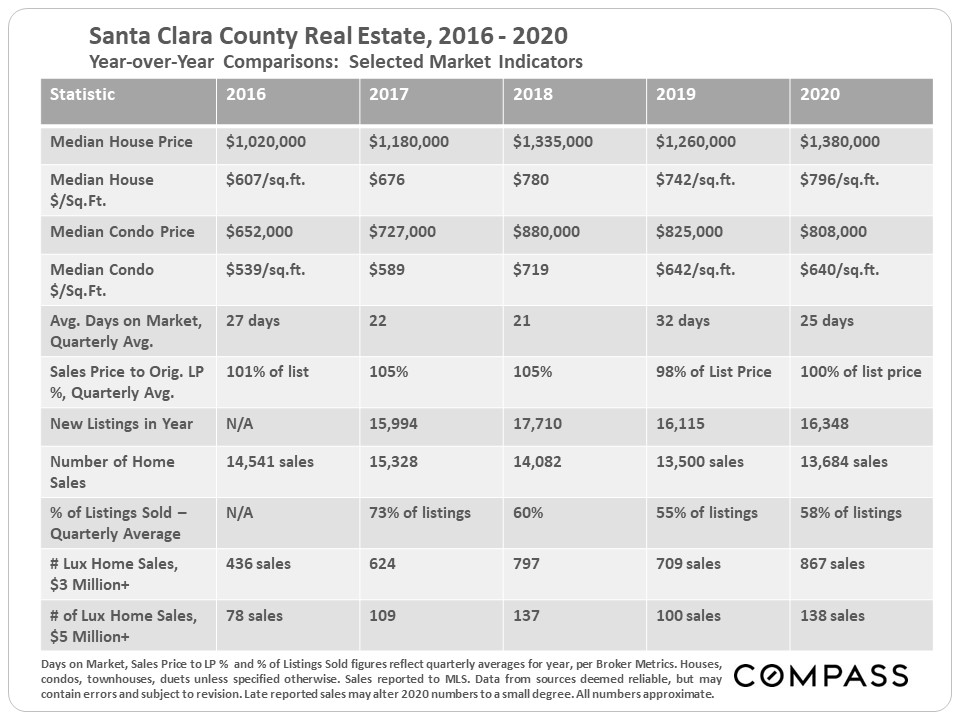
To begin, let’s compare the Santa Clara 2020 real estate market compared to the four years which preceded it:
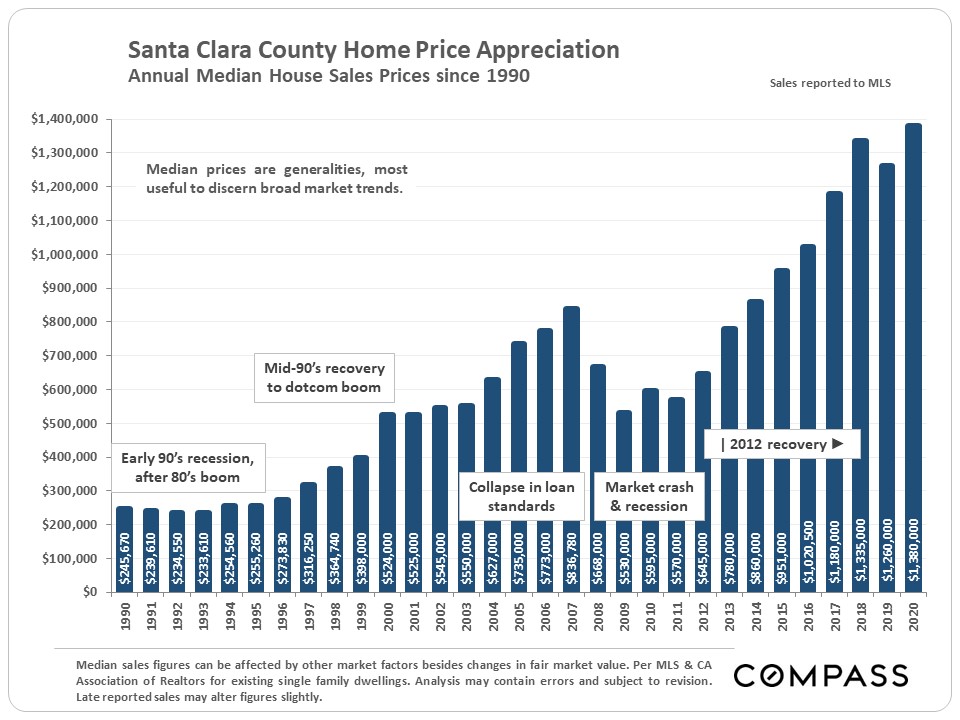
Next, check out this graph showing home price appreciation in Santa Clara County since 1990. As you can see, the median price in Santa Clara County set a record for 2020, just edging out 2018.
Next, look at the median house price change since 1994, year over year. You’ll see that prices were up 10% year over year in Santa Clara County, after dipping 6% in 2019. 10% sounds like a lot, but it is considerably less than we’ve seen in other years.

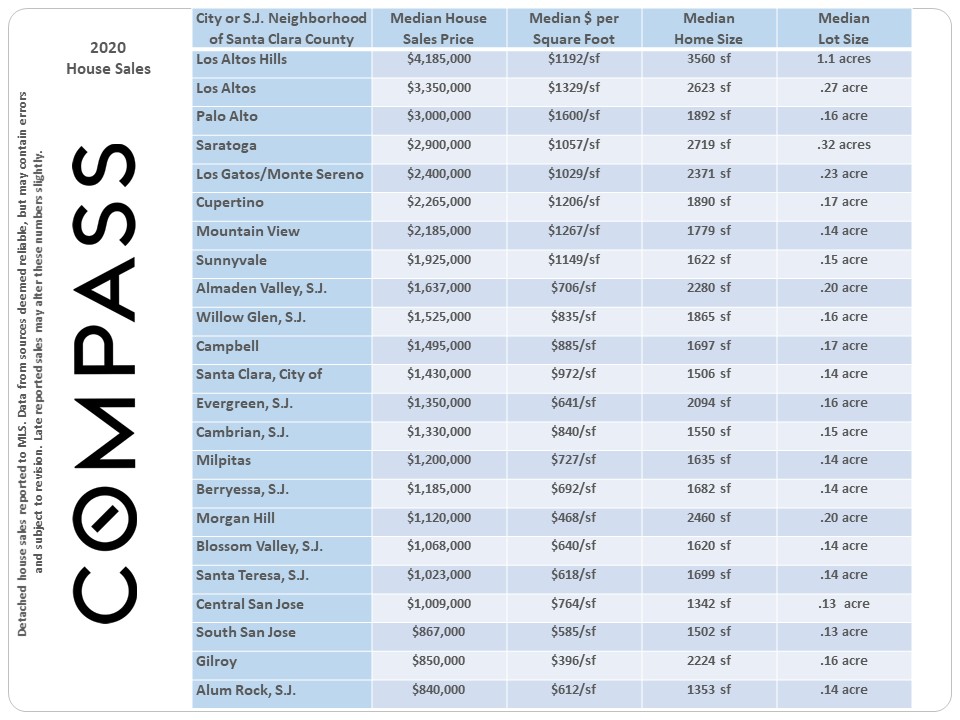
Santa Clara county is home to millions of people and there are many communities in it, so it’s helpful to break down the data into different communities and for different metrics. I find it’s very illustrative to look especially at the price per square foot, as in the chart below.
The picture is less rosy when it comes to the condo market. The median condo price is down about 10% from its peak in 2018, and down slightly from 2019.

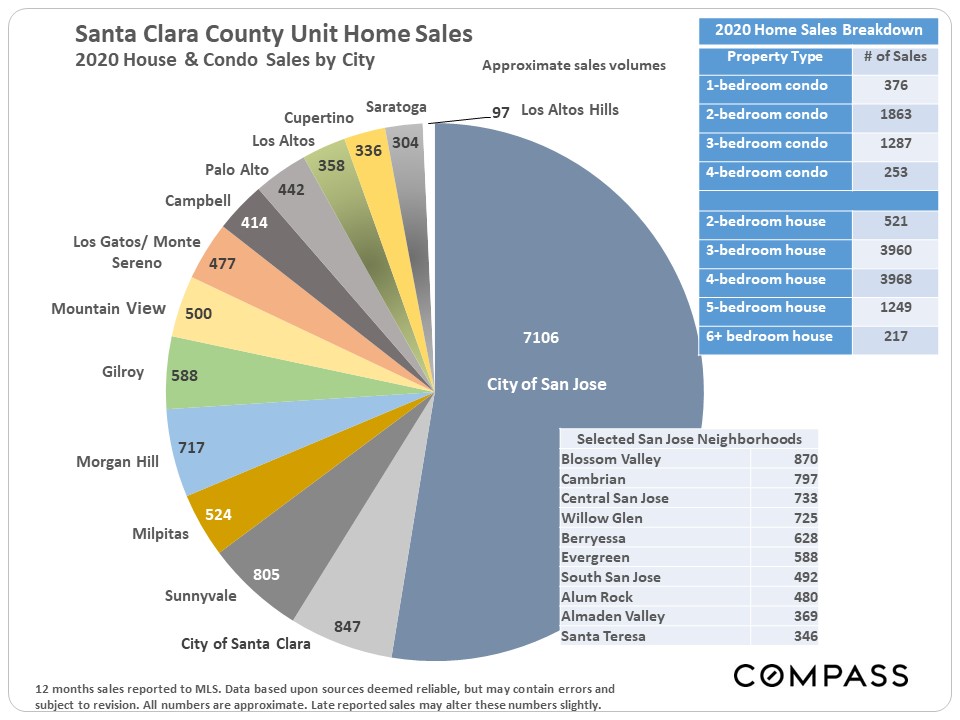
The next chart shows how many home sales are happening by locality, with the city of San Jose accounting for over half of all home sales in the county.
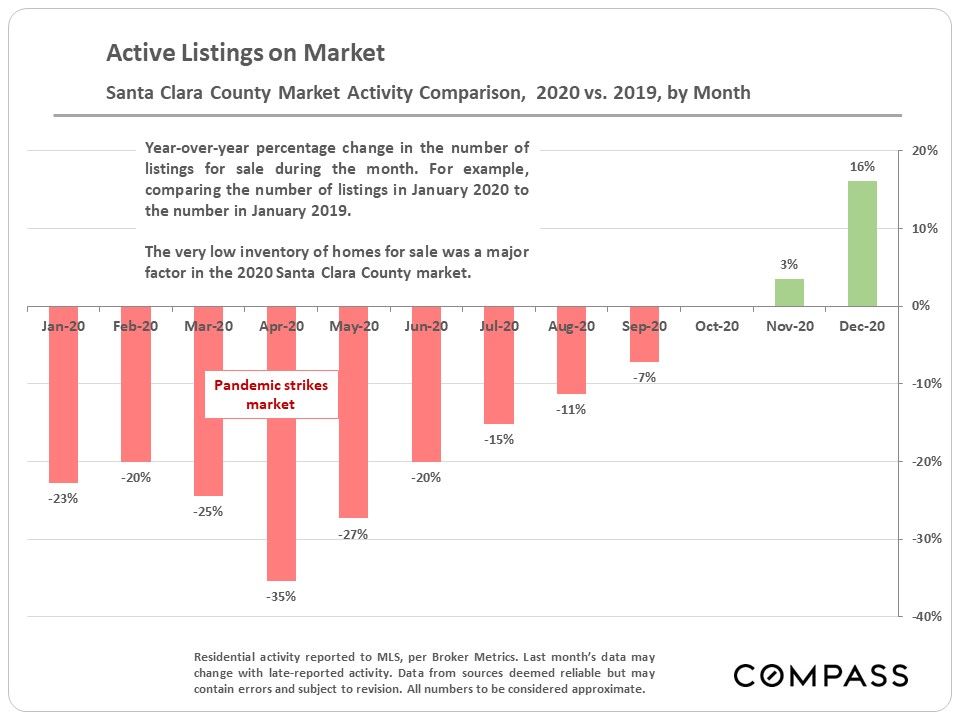
One of the notable aspects in the 2020 Santa Clara County real estate market was the lack of inventory. This next chart shows by how much new listings increased or decreased compared to the prior year. For most of the year, there were fewer listings coming onto the market than the year prior.
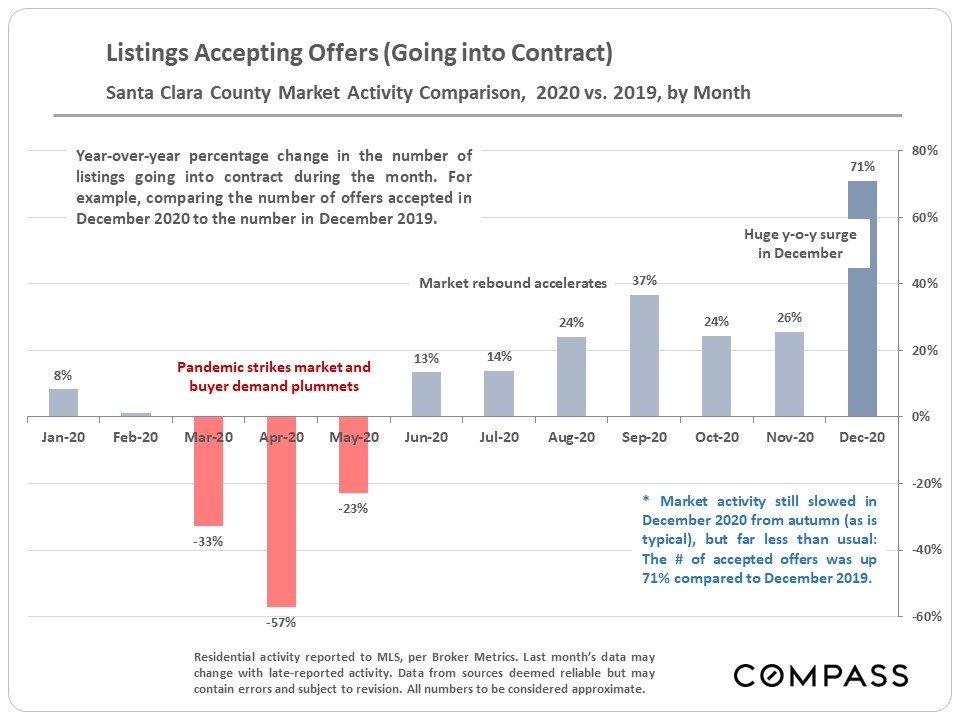
Sales, not listings, is where the rubber meets the road in real estate, and the following chart shows by how much sales increased or decreased each month compared to the year prior. The second half of 2020 showed significant increases in sales, with December up a whopping 71% over the prior year.
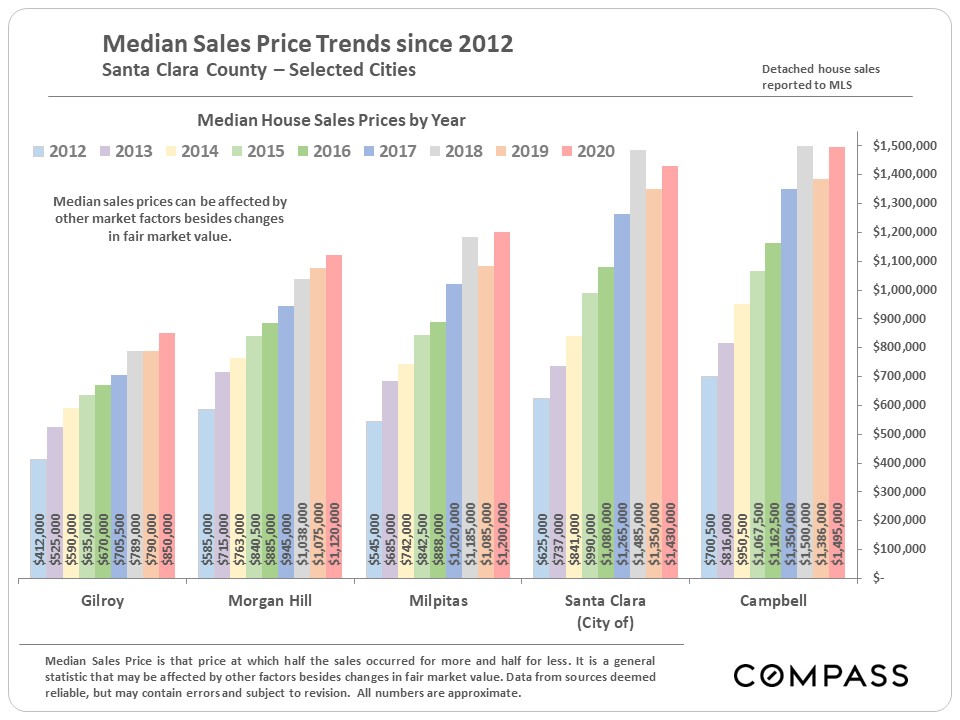
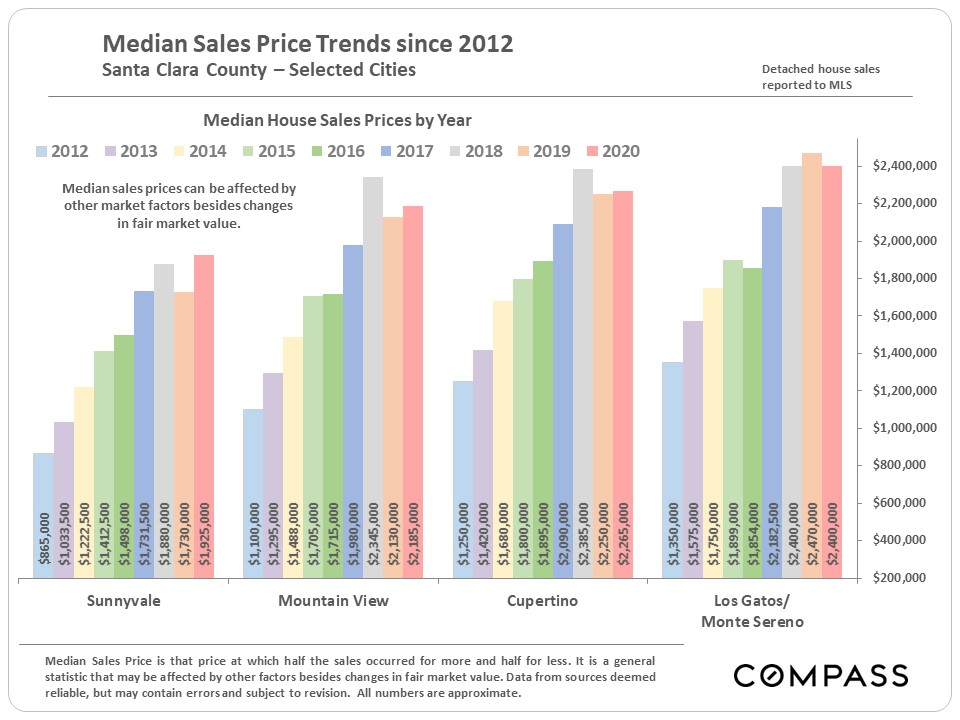
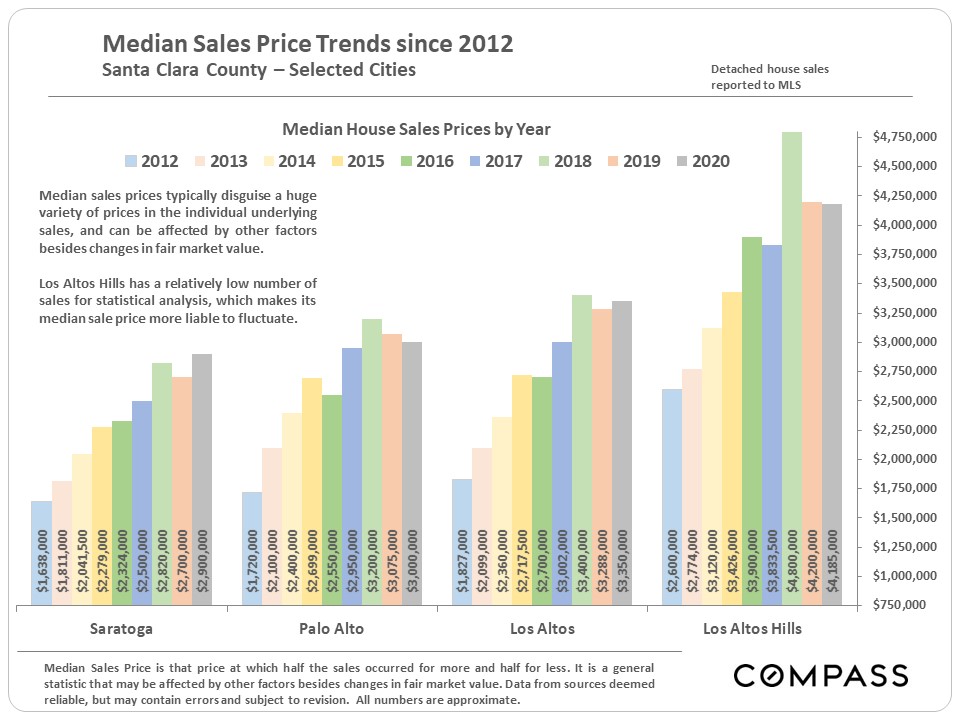
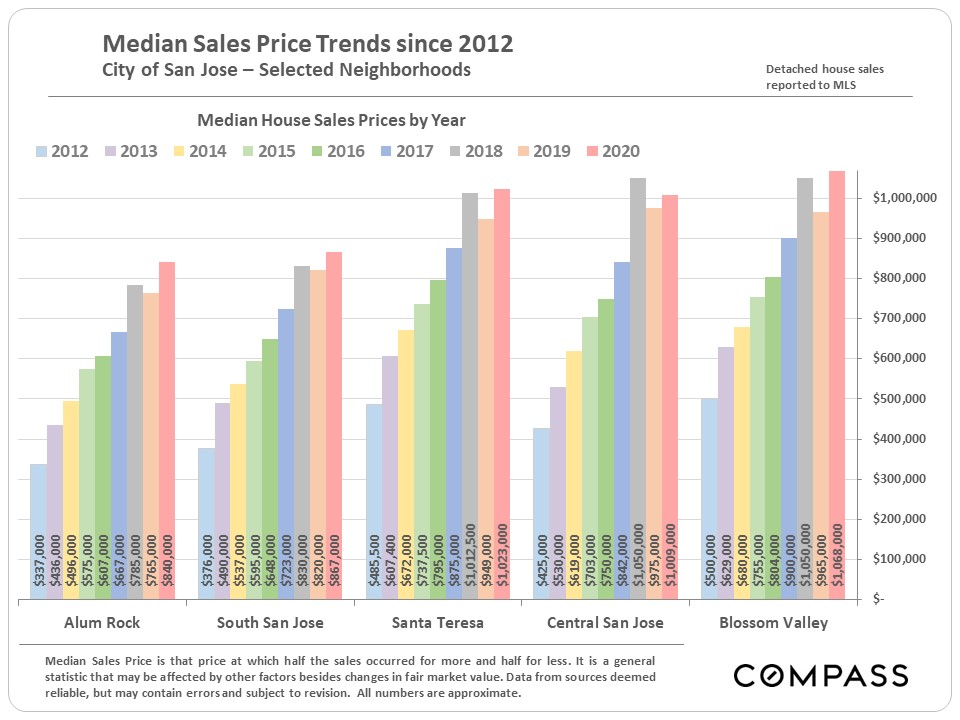
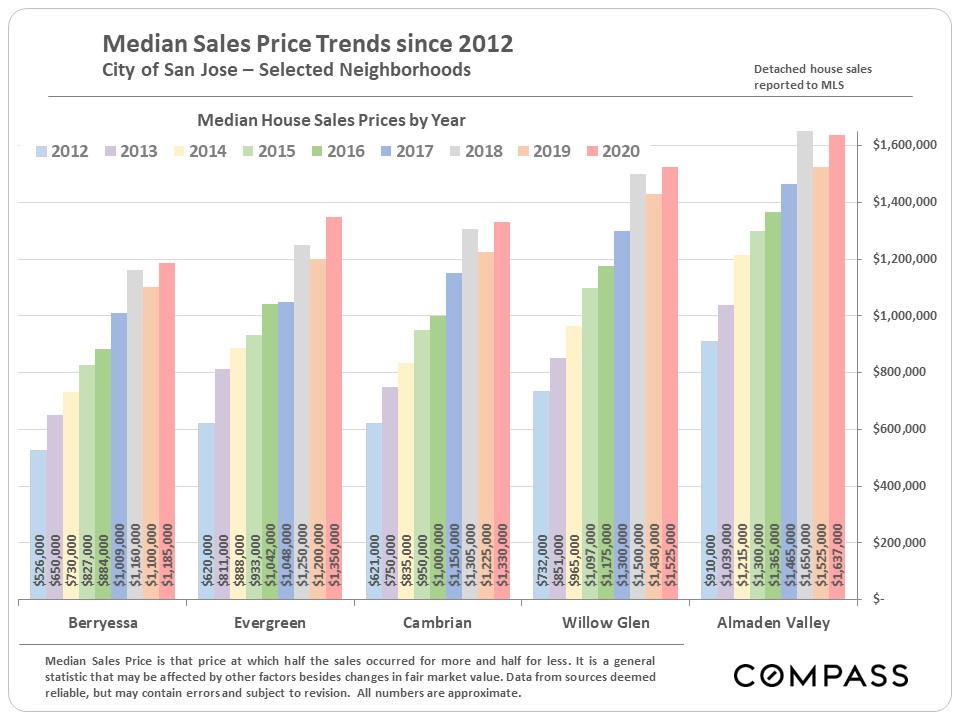
The next five charts show the median sale price trends since 2012 (when the recover after the 2008 mortgage crisis began in earnest), broken down by a number of different cities and areas of Santa Clara County.
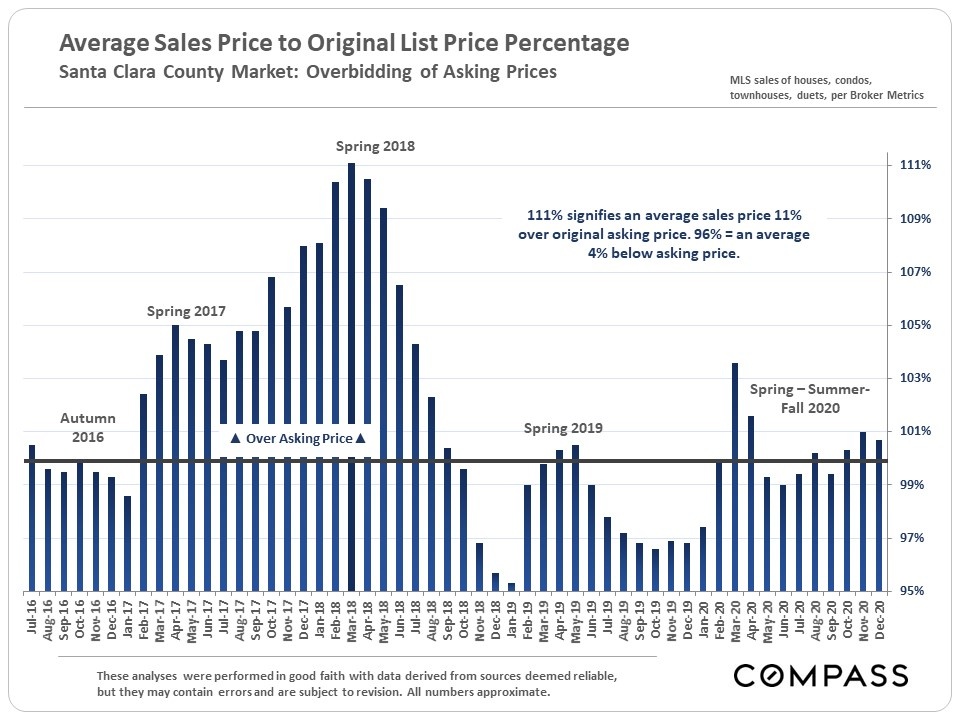
The following chart shows the average sales price to original listing price. You’ll note that the ratio was much higher in 2017 and 2018 than in 2020, for the most part. I believe that this had a lot to do with a change in marketing strategy. Whereas homes may have been deliberately under-priced in 2017/2018 to attract multiple offers, with the COVID-19 pandemic, many sellers chose to price their homes at closer to what they expected they would sell for, not taking a chance on a bidding war.
Lastly, this chart shows the median sale price changes (mostly for single family homes) in dollars, rather than as a percentage. Note that this chart is for the Bay Area as a whole, and not just Santa Clara County.

Looking back at 2020 as a whole, it is clear that the Santa Cruz County real estate market defied all expectations. The question many readers will have now is: what will the 2021 real estate market be like? Look for me to address that question in future posts here on this site.
Time to talk to a REALTOR?