
Category: Charts and Statistics
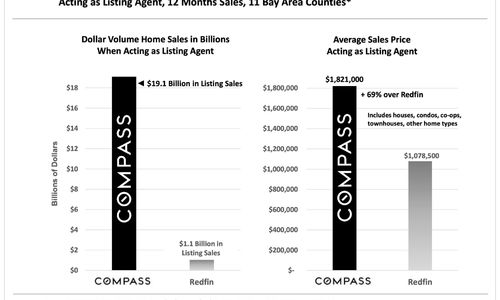
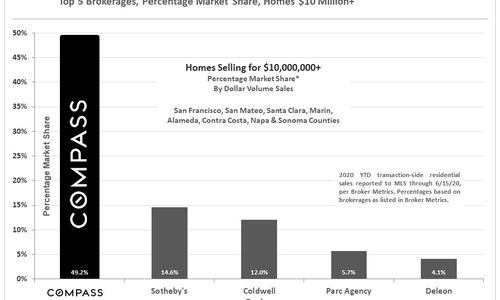
Compass Bay Area Market Share
Prior to 2018, few people in the San Francisco Bay Area had heard of Compass, the combo tech startup / real estate brokerage based in…

Blog, Charts and Statistics, Commentary, Negotiation, North Monterey County Real Estate, Santa Cruz Real Estate, Sellers, Silicon Valley Real Estate
How Multiple Offers Affect Sale Price
It's that time of year again! Early in the year, inventory is low - but there's no shortage of eager buyers looking to purchase a…

What Is the Strongest Tailwind Today’s Recovering Economy?
Last year started off with a bang. Unemployment was under 4%, forecasters were giddy with their projections for the economy, and the residential housing market had the…
Charts and Statistics, North Monterey County Real Estate, Santa Clara County, Santa Cruz County, Santa Cruz Real Estate, Silicon Valley Real Estate
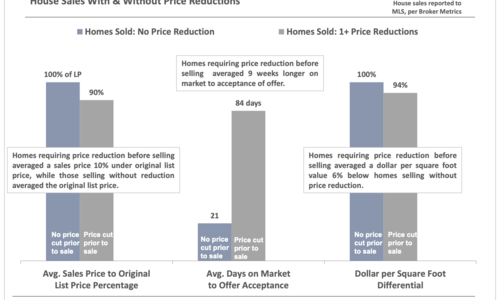
The Dangers of Overpricing your Home
The Truth about Overpricing your Bay Area homeClick here to skip down to the charts and graphs for Santa Clara, Santa Cruz, and Monterey counties.Fair…
The 7-10 Year Real Estate Cycle
This morning I watched a new YouTube video by an agent in Utah that had recently been posted which touched on the 7-10 Year Real…